
- Start >
- Rivers >
- Discharge >
- Untere Donau >
- Grafenau >
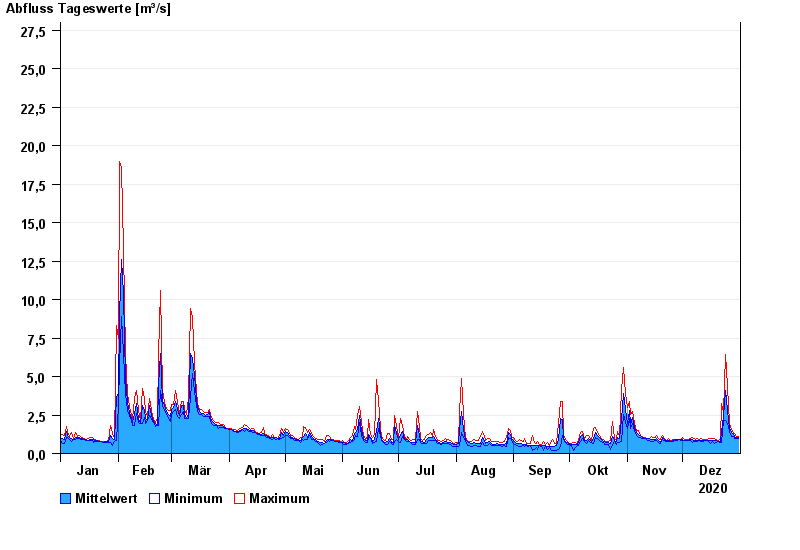
- Chart of year

Chart of year Grafenau / Kleine Ohe
Discharge from 01.01.2020 to 31.12.2020
- 12.08.2002 Abfluss: 71,2 m³/s
- 13.08.2002 Abfluss: 66,3 m³/s
- 21.12.1993 Abfluss: 51,4 m³/s
- 21.03.2002 Abfluss: 47,3 m³/s
- 09.08.2002 Abfluss: 37,2 m³/s
| Date | Mean value [m³/s] | Maximum [m³/s] | Minimum [m³/s] |
|---|---|---|---|
| 31.12.2020 | 1.01 | 1.08 | 0.995 |
| 30.12.2020 | 1.05 | 1.13 | 0.955 |
| 29.12.2020 | 1.12 | 1.28 | 0.996 |
| 28.12.2020 | 1.21 | 1.33 | 1.08 |
| 27.12.2020 | 1.37 | 1.57 | 1.13 |
| 26.12.2020 | 1.63 | 1.98 | 1.45 |
| 25.12.2020 | 2.82 | 4.33 | 1.98 |
© Bayerisches Landesamt für Umwelt 2024