
- Start >
- Rivers >
- Discharge >
- Untere Donau >
- Grafenau >
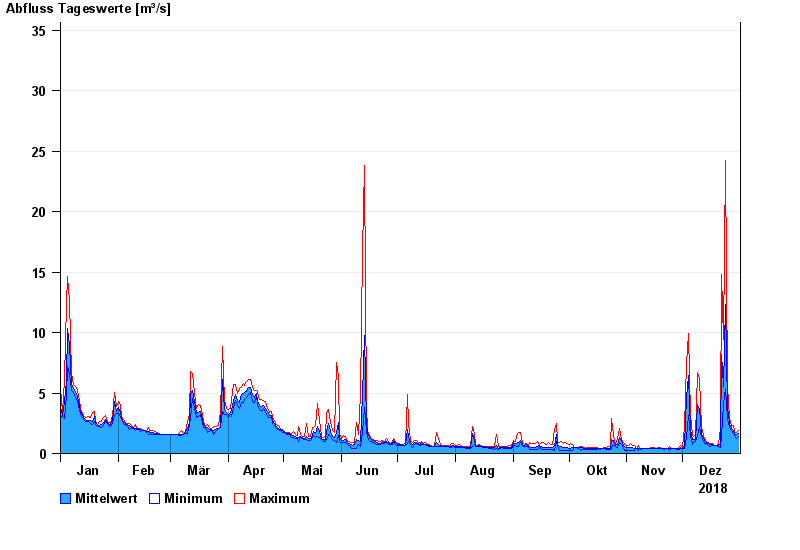
- Chart of year

Chart of year Grafenau / Kleine Ohe
Discharge from 01.01.2018 to 31.12.2018
- 12.08.2002 Abfluss: 71,2 m³/s
- 13.08.2002 Abfluss: 66,3 m³/s
- 21.12.1993 Abfluss: 51,4 m³/s
- 21.03.2002 Abfluss: 47,3 m³/s
- 09.08.2002 Abfluss: 37,2 m³/s
| Date | Mean value [m³/s] | Maximum [m³/s] | Minimum [m³/s] |
|---|---|---|---|
| 31.12.2018 | 1.65 | 1.93 | 1.39 |
| 30.12.2018 | 1.53 | 1.74 | 1.23 |
| 29.12.2018 | 1.62 | 1.83 | 1.46 |
| 28.12.2018 | 1.89 | 2.34 | 1.64 |
| 27.12.2018 | 2.06 | 2.22 | 1.92 |
| 26.12.2018 | 2.47 | 2.9 | 2.12 |
| 25.12.2018 | 3.84 | 5.51 | 2.9 |
© Bayerisches Landesamt für Umwelt 2024