
- Start >
- Rivers >
- Discharge >
- Untere Donau >
- Grafenau >
- Chart of year

Chart of year Grafenau / Kleine Ohe
Discharge from 30.03.2024 to 29.03.2025
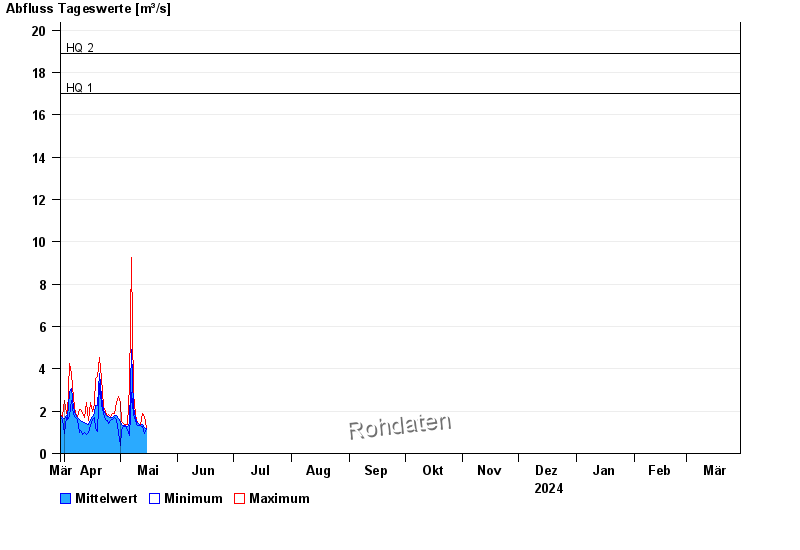
- HQ1 17 m³/s
- HQ2 18,9 m³/s
- HQ5 24,2 m³/s
- HQ10 28,6 m³/s
- HQ20 33,1 m³/s
- HQ50 39,9 m³/s
- HQ100 45,4 m³/s
| Date | Mean value [m³/s] | Maximum [m³/s] | Minimum [m³/s] |
|---|---|---|---|
| 29.04.2024 | 1.85 | 2.4 | 1.12 |
| 28.04.2024 | 1.8 | 1.91 | 1.7 |
| 27.04.2024 | 1.72 | 1.91 | 1.63 |
| 26.04.2024 | 1.69 | 1.76 | 1.57 |
| 25.04.2024 | 1.73 | 1.84 | 1.44 |
| 24.04.2024 | 1.73 | 1.76 | 1.57 |
| 23.04.2024 | 1.82 | 1.98 | 1.63 |
© Bayerisches Landesamt für Umwelt 2024