
- Start >
- Rivers >
- Discharge >
- Untere Donau >
- Grafenau >
- Chart of year

Chart of year Grafenau / Kleine Ohe
Discharge from 28.09.2018 to 27.09.2019
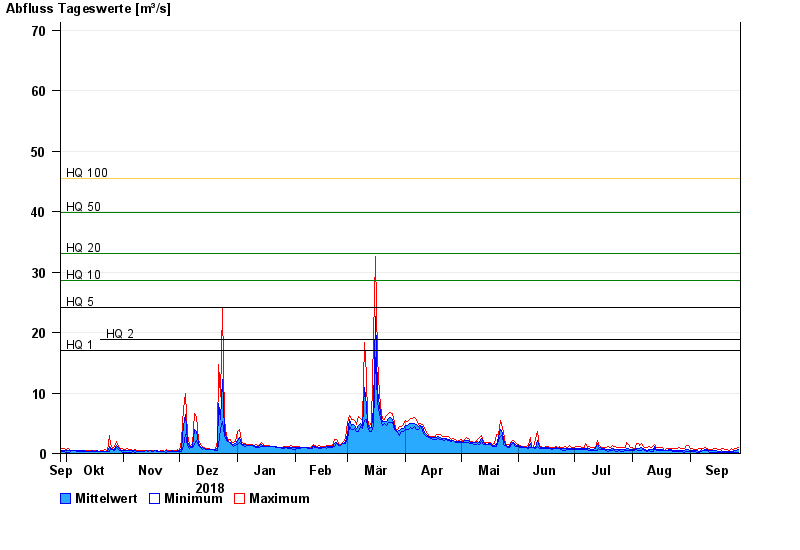
- HQ1 17 m³/s
- HQ2 18,9 m³/s
- HQ5 24,2 m³/s
- HQ10 28,6 m³/s
- HQ20 33,1 m³/s
- HQ50 39,9 m³/s
- HQ100 45,4 m³/s
| Date | Mean value [m³/s] | Maximum [m³/s] | Minimum [m³/s] |
|---|---|---|---|
| 27.09.2019 | 0.581 | 0.943 | 0.213 |
| 26.09.2019 | 0.445 | 0.752 | 0.213 |
| 25.09.2019 | 0.451 | 0.751 | 0.237 |
| 24.09.2019 | 0.4 | 0.573 | 0.212 |
| 23.09.2019 | 0.383 | 0.861 | 0.206 |
| 22.09.2019 | 0.342 | 0.578 | 0.208 |
| 21.09.2019 | 0.342 | 0.581 | 0.209 |
© Bayerisches Landesamt für Umwelt 2024