
- Start >
- Rivers >
- Discharge >
- Untere Donau >
- Grafenau >
- Chart of year

Chart of year Grafenau / Kleine Ohe
Discharge from 20.09.2021 to 19.09.2022
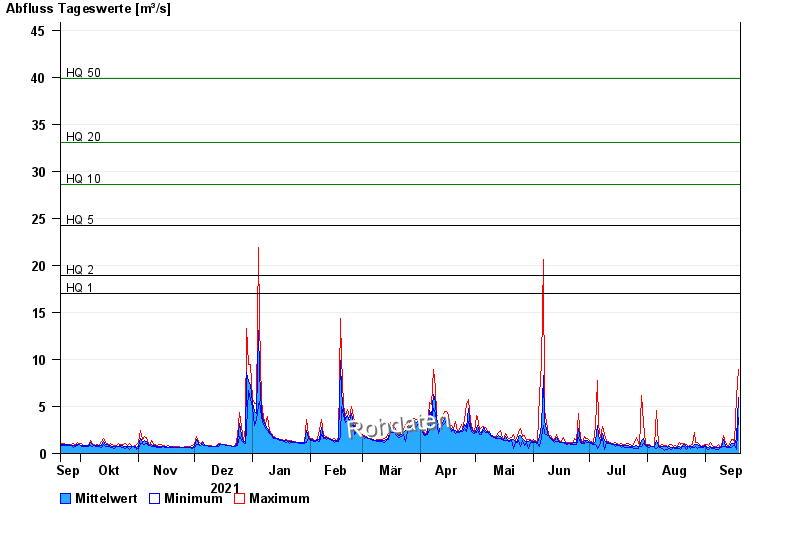
- HQ1 17 m³/s
- HQ2 18,9 m³/s
- HQ5 24,2 m³/s
- HQ10 28,6 m³/s
- HQ20 33,1 m³/s
- HQ50 39,9 m³/s
- HQ100 45,4 m³/s
| Date | Mean value [m³/s] | Maximum [m³/s] | Minimum [m³/s] |
|---|---|---|---|
| 19.09.2022 | 5.94 | 8.92 | 3.8 |
| 18.09.2022 | 1.62 | 6.08 | 0.455 |
| 17.09.2022 | 0.915 | 1.13 | 0.803 |
| 16.09.2022 | 1.09 | 1.45 | 0.877 |
| 15.09.2022 | 1.11 | 1.51 | 0.665 |
| 14.09.2022 | 0.723 | 0.915 | 0.635 |
| 13.09.2022 | 0.682 | 0.736 | 0.635 |
© Bayerisches Landesamt für Umwelt 2024