
- Start >
- Rivers >
- Discharge >
- Untere Donau >
- Grafenau >
- Chart of year

Chart of year Grafenau / Kleine Ohe
Discharge from 01.01.2023 to 31.12.2023
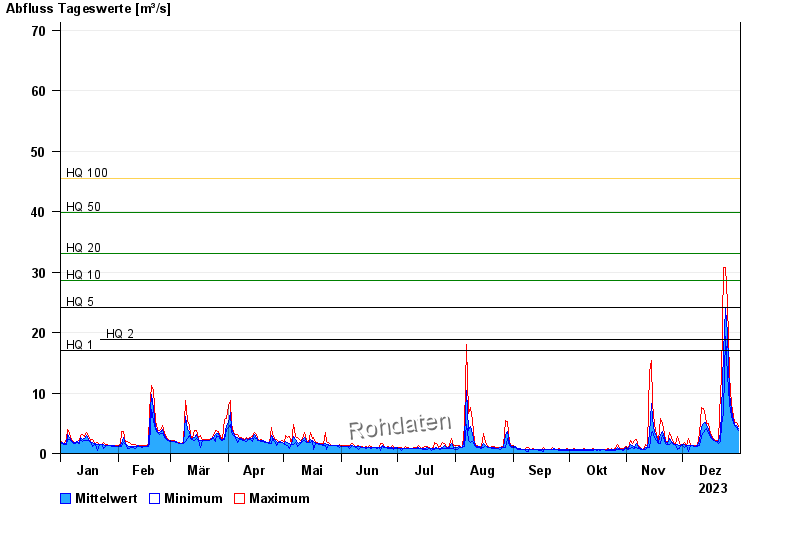
- HQ1 17 m³/s
- HQ2 18,9 m³/s
- HQ5 24,2 m³/s
- HQ10 28,6 m³/s
- HQ20 33,1 m³/s
- HQ50 39,9 m³/s
- HQ100 45,4 m³/s
| Date | Mean value [m³/s] | Maximum [m³/s] | Minimum [m³/s] |
|---|---|---|---|
| 31.12.2023 | 4.15 | 4.53 | 3.78 |
| 30.12.2023 | 4.66 | 5.07 | 4.27 |
| 29.12.2023 | 4.87 | 5.2 | 4.66 |
| 28.12.2023 | 5.51 | 6.06 | 5.2 |
| 27.12.2023 | 7.1 | 8.16 | 6.2 |
| 26.12.2023 | 9.99 | 12.9 | 8.34 |
| 25.12.2023 | 19.9 | 24.9 | 12.9 |
© Bayerisches Landesamt für Umwelt 2024