
- Start >
- Rivers >
- Discharge >
- Untere Donau >
- Freising >
- Chart of year

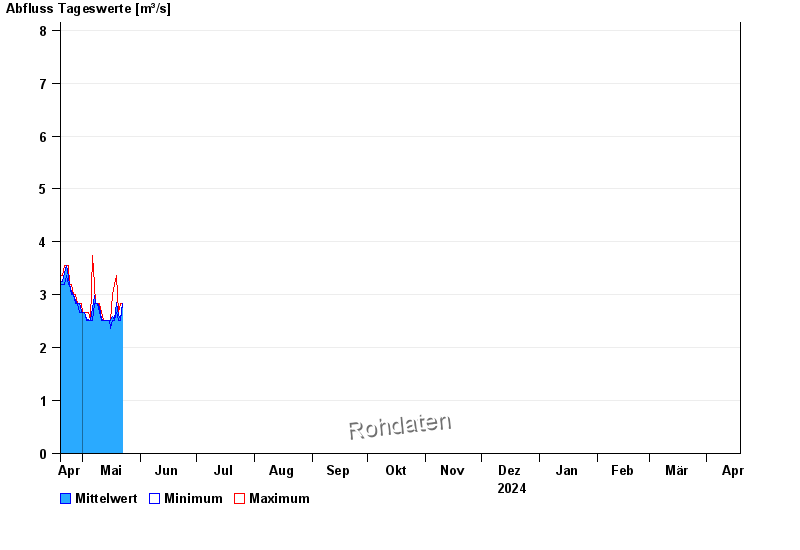
Chart of year Freising / Moosach
Discharge from 19.04.2024 to 18.04.2025
 Für diesen Pegel sind keine Jährlichkeiten hinterlegt.
| Date | Mean value [m³/s] | Maximum [m³/s] | Minimum [m³/s] |
|---|---|---|---|
| 04.06.2024 | 8.17 | 8.76 | 6.72 |
| 03.06.2024 | 9.46 | 10.4 | 8.22 |
| 02.06.2024 | 11.2 | 11.9 | 10.4 |
| 01.06.2024 | 9.73 | 12.1 | 6.14 |
| 31.05.2024 | 4.6 | 6.14 | 3.56 |
| 30.05.2024 | 3.51 | 3.56 | 3.37 |
| 29.05.2024 | 3.73 | 3.95 | 3.37 |
© Bayerisches Landesamt für Umwelt 2024