
- Start >
- Rivers >
- Discharge >
- Untere Donau >
- Eggenfelden >
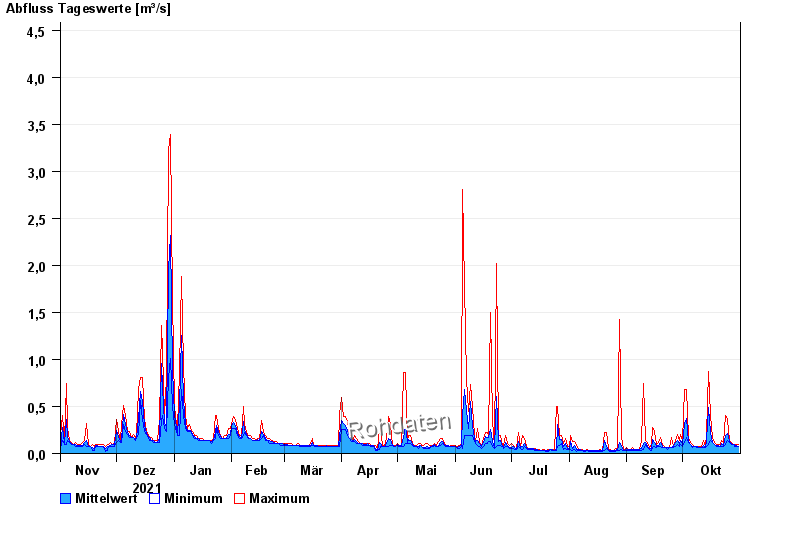
- Chart of year

Chart of year Eggenfelden / Mertseebach
Discharge from 01.11.2021 to 31.10.2022
- 02.03.1987 Abfluss: 13,3 m³/s
- 13.01.2011 Abfluss: 12,8 m³/s
- 02.06.2013 Abfluss: 11,5 m³/s
- 02.08.1991 Abfluss: 11,2 m³/s
- 17.07.2010 Abfluss: 9,99 m³/s
| Date | Mean value [m³/s] | Maximum [m³/s] | Minimum [m³/s] |
|---|---|---|---|
| 31.10.2022 | 0.079 | 0.094 | 0.076 |
| 30.10.2022 | 0.086 | 0.094 | 0.076 |
| 29.10.2022 | 0.092 | 0.094 | 0.076 |
| 28.10.2022 | 0.094 | 0.094 | 0.094 |
| 27.10.2022 | 0.103 | 0.115 | 0.094 |
| 26.10.2022 | 0.123 | 0.139 | 0.115 |
| 25.10.2022 | 0.216 | 0.359 | 0.139 |
© Bayerisches Landesamt für Umwelt 2024