
- Start >
- Rivers >
- Discharge >
- Untere Donau >
- Eggenfelden >
- Chart of year

Chart of year Eggenfelden / Mertseebach
Discharge from 28.09.2020 to 27.09.2021
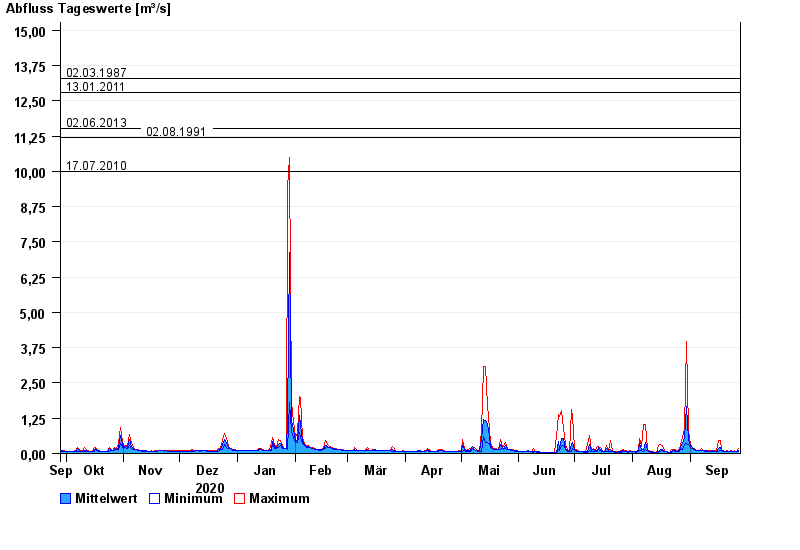
- 02.03.1987 Abfluss: 13,3 m³/s
- 13.01.2011 Abfluss: 12,8 m³/s
- 02.06.2013 Abfluss: 11,5 m³/s
- 02.08.1991 Abfluss: 11,2 m³/s
- 17.07.2010 Abfluss: 9,99 m³/s
| Date | Mean value [m³/s] | Maximum [m³/s] | Minimum [m³/s] |
|---|---|---|---|
| 27.09.2021 | 0.119 | 0.173 | 0.063 |
| 26.09.2021 | 0.066 | 0.079 | 0.063 |
| 25.09.2021 | 0.074 | 0.097 | 0.063 |
| 24.09.2021 | 0.078 | 0.079 | 0.063 |
| 23.09.2021 | 0.08 | 0.098 | 0.063 |
| 22.09.2021 | 0.074 | 0.079 | 0.063 |
| 21.09.2021 | 0.088 | 0.119 | 0.079 |
© Bayerisches Landesamt für Umwelt 2024