
- Start >
- Rivers >
- Discharge >
- Untere Donau >
- Eggenfelden >
- Chart of year

Chart of year Eggenfelden / Mertseebach
Discharge from 25.01.2017 to 24.01.2018
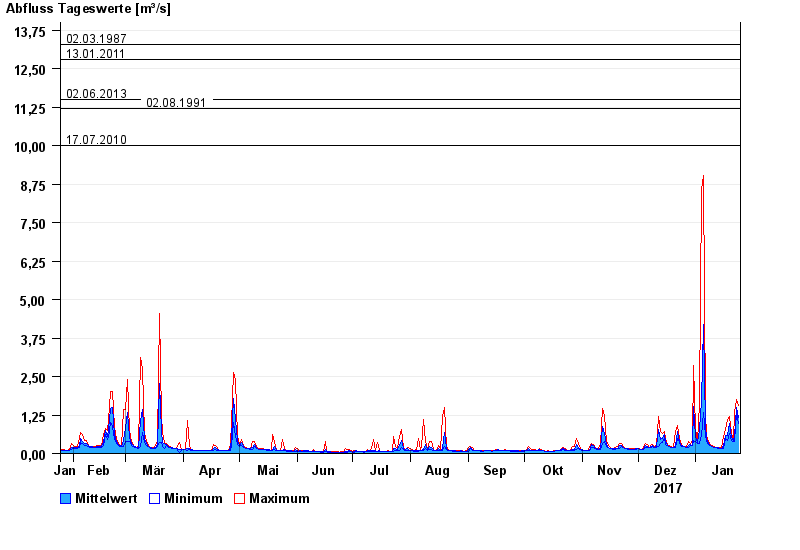
- 02.03.1987 Abfluss: 13,3 m³/s
- 13.01.2011 Abfluss: 12,8 m³/s
- 02.06.2013 Abfluss: 11,5 m³/s
- 02.08.1991 Abfluss: 11,2 m³/s
- 17.07.2010 Abfluss: 9,99 m³/s
| Date | Mean value [m³/s] | Maximum [m³/s] | Minimum [m³/s] |
|---|---|---|---|
| 24.01.2018 | 1.18 | 1.55 | 0.978 |
| 23.01.2018 | 1.5 | 1.77 | 1.33 |
| 22.01.2018 | 0.539 | 1.33 | 0.384 |
| 21.01.2018 | 0.427 | 0.432 | 0.384 |
| 20.01.2018 | 0.512 | 0.653 | 0.432 |
| 19.01.2018 | 0.979 | 1.19 | 0.653 |
| 18.01.2018 | 0.579 | 1.12 | 0.433 |
© Bayerisches Landesamt für Umwelt 2024