
- Start >
- Rivers >
- Discharge >
- Untere Donau >
- Eggenfelden >
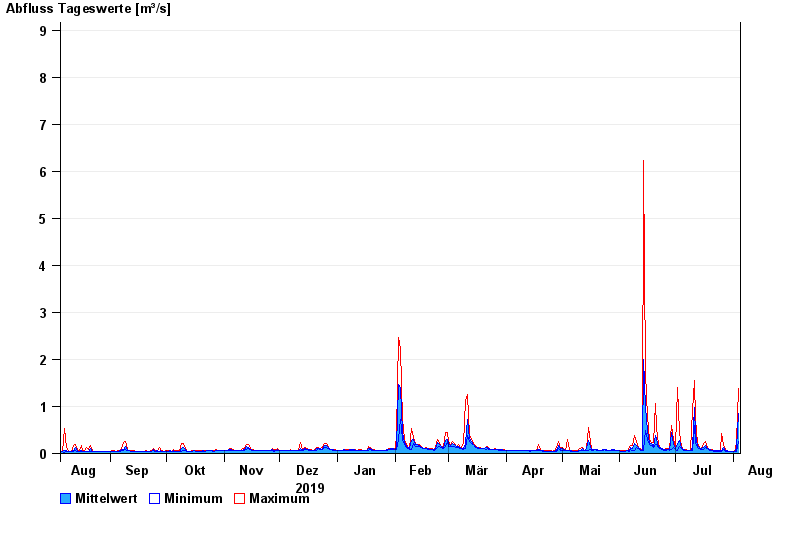
- Chart of year

Chart of year Eggenfelden / Mertseebach
Discharge from 05.08.2019 to 04.08.2020
- 02.03.1987 Abfluss: 13,3 m³/s
- 13.01.2011 Abfluss: 12,8 m³/s
- 02.06.2013 Abfluss: 11,5 m³/s
- 02.08.1991 Abfluss: 11,2 m³/s
- 17.07.2010 Abfluss: 9,99 m³/s
| Date | Mean value [m³/s] | Maximum [m³/s] | Minimum [m³/s] |
|---|---|---|---|
| 04.08.2020 | 0.847 | 1.39 | 0.245 |
| 03.08.2020 | 0.119 | 0.245 | 0.051 |
| 02.08.2020 | 0.048 | 0.082 | 0.039 |
| 01.08.2020 | 0.049 | 0.052 | 0.04 |
| 31.07.2020 | 0.051 | 0.052 | 0.04 |
| 30.07.2020 | 0.052 | 0.052 | 0.052 |
| 29.07.2020 | 0.055 | 0.066 | 0.052 |
© Bayerisches Landesamt für Umwelt 2024