
- Start >
- Rivers >
- Discharge >
- Untere Donau >
- Eberhardsreuth >
- Chart of year

Chart of year Eberhardsreuth / Mitternacher Ohe
Discharge from 20.04.2021 to 19.04.2022
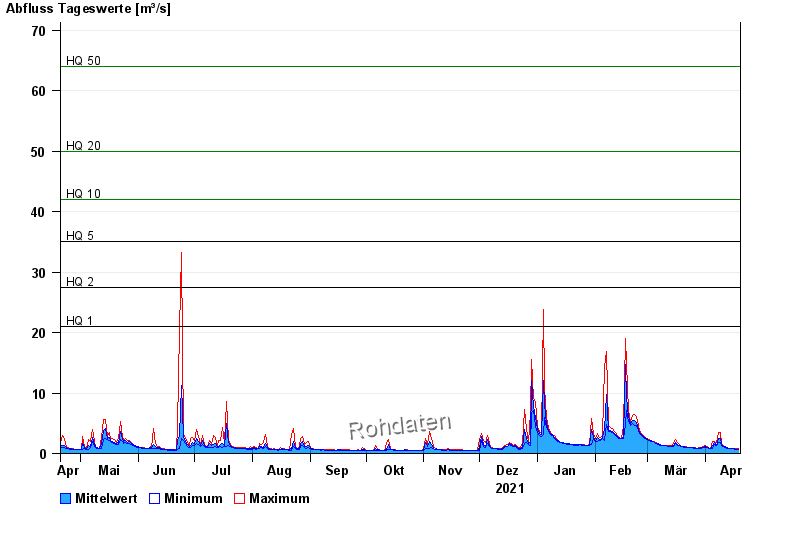
- HQ1 21 m³/s
- HQ2 27,5 m³/s
- HQ5 35 m³/s
- HQ10 42 m³/s
- HQ20 50 m³/s
- HQ50 64 m³/s
- HQ100 75 m³/s
| Date | Mean value [m³/s] | Maximum [m³/s] | Minimum [m³/s] |
|---|---|---|---|
| 19.04.2022 | 0.734 | 0.785 | 0.732 |
| 18.04.2022 | 0.743 | 0.785 | 0.732 |
| 17.04.2022 | 0.767 | 0.841 | 0.732 |
| 16.04.2022 | 0.795 | 0.841 | 0.785 |
| 15.04.2022 | 0.867 | 0.902 | 0.785 |
| 14.04.2022 | 0.895 | 0.902 | 0.841 |
| 13.04.2022 | 0.966 | 1.03 | 0.902 |
© Bayerisches Landesamt für Umwelt 2024