
- Start >
- Rivers >
- Discharge >
- Untere Donau >
- Drachensee Speicherabfluss >
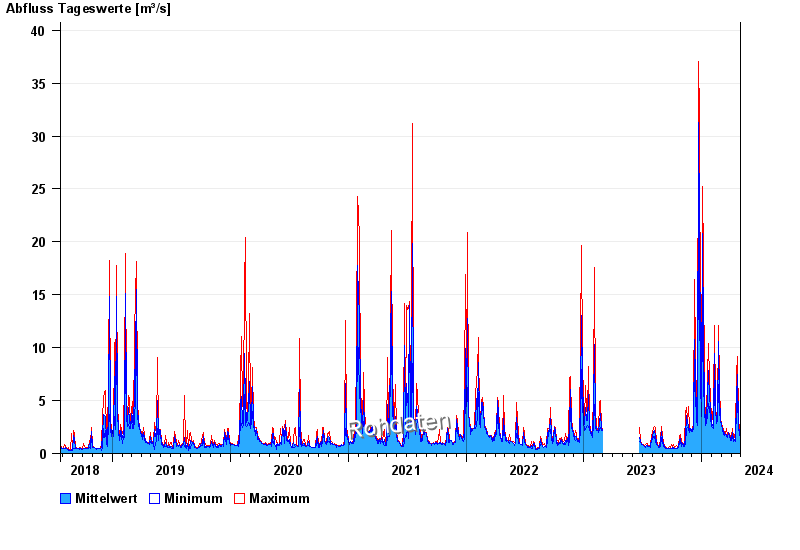
- Chart of total period

Chart of total period Drachensee Speicherabfluss / Chamb
Discharge from 25.07.2018 to 29.04.2024
 Für diesen Pegel sind keine Hauptwerte hinterlegt.
| Date | Mean value [m³/s] | Maximum [m³/s] | Minimum [m³/s] |
|---|---|---|---|
| 29.04.2024 | 1.44 | 1.55 | 1.29 |
| 28.04.2024 | 1.68 | 1.79 | 1.47 |
| 27.04.2024 | 1.85 | 1.96 | 1.79 |
| 26.04.2024 | 2.14 | 2.31 | 1.96 |
| 25.04.2024 | 2.3 | 2.31 | 2.05 |
| 24.04.2024 | 2.49 | 3.24 | 2.31 |
| 23.04.2024 | 2.43 | 2.9 | 2.31 |
© Bayerisches Landesamt für Umwelt 2024