
- Start >
- Rivers >
- Discharge >
- Untere Donau >
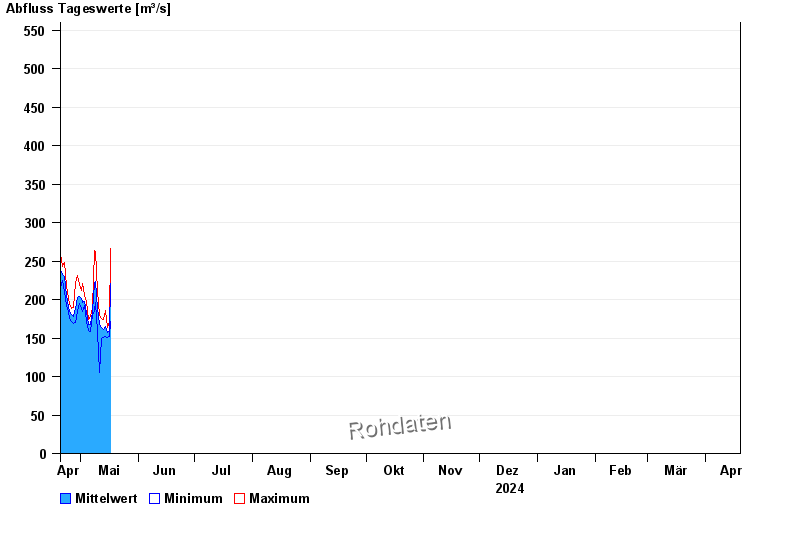
- Donauwörth >
- Chart of year

Chart of year Donauwörth / Donau
Discharge from 20.04.2024 to 19.04.2025
- HQ1 680 m³/s
- HQ2 800 m³/s
- HQ5 900 m³/s
- HQ10 1020 m³/s
- HQ20 1150 m³/s
- HQ50 1300 m³/s
- HQ100 1450 m³/s
| Date | Mean value [m³/s] | Maximum [m³/s] | Minimum [m³/s] |
|---|---|---|---|
| 01.06.2024 | 805 | 938 | 613 |
| 31.05.2024 | 397 | 608 | 301 |
| 30.05.2024 | 260 | 299 | 243 |
| 29.05.2024 | 286 | 329 | 257 |
| 28.05.2024 | 289 | 329 | 245 |
| 27.05.2024 | 250 | 269 | 242 |
| 26.05.2024 | 304 | 350 | 261 |
© Bayerisches Landesamt für Umwelt 2024