
- Start >
- Rivers >
- Discharge >
- Untere Donau >
- Chamerau >
- Chart of year

Chart of year Chamerau / Regen
Discharge from 01.01.2022 to 31.12.2022
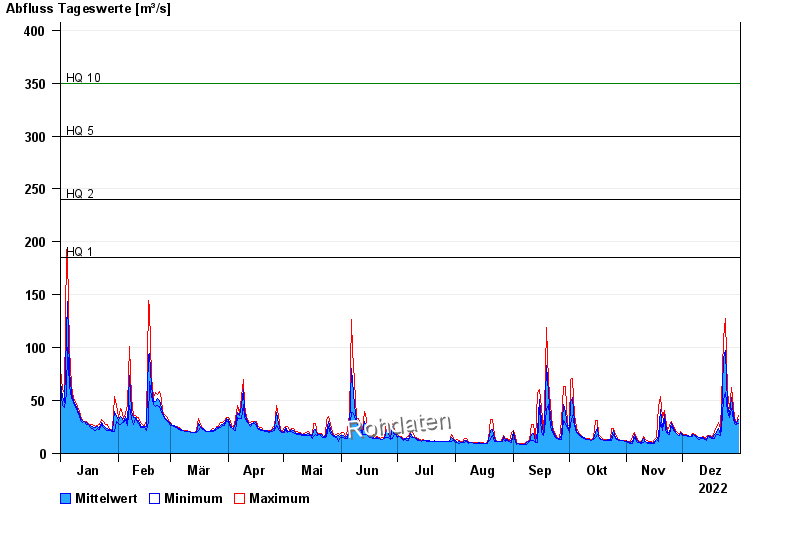
- HQ1 185 m³/s
- HQ2 240 m³/s
- HQ5 300 m³/s
- HQ10 350 m³/s
- HQ20 410 m³/s
- HQ50 500 m³/s
- HQ100 560 m³/s
| Date | Mean value [m³/s] | Maximum [m³/s] | Minimum [m³/s] |
|---|---|---|---|
| 31.12.2022 | 32.5 | 35.5 | 27.9 |
| 30.12.2022 | 28 | 28.9 | 27.4 |
| 29.12.2022 | 31.2 | 33.8 | 27.9 |
| 28.12.2022 | 36.9 | 44.1 | 32.6 |
| 27.12.2022 | 52.8 | 62.7 | 42.9 |
| 26.12.2022 | 37 | 42.2 | 34.4 |
| 25.12.2022 | 46.5 | 57.6 | 39.7 |
© Bayerisches Landesamt für Umwelt 2024