
- Start >
- Rivers >
- Discharge >
- Untere Donau >
- Bruckhäuser >
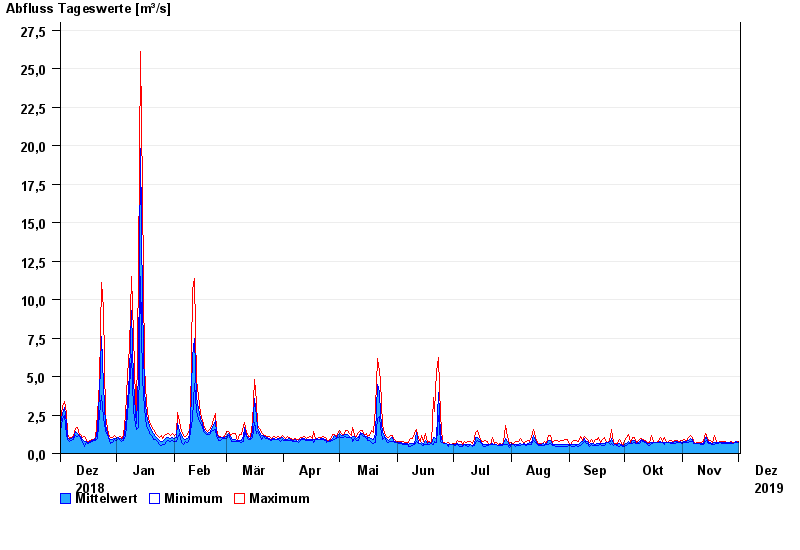
- Chart of year

Chart of year Bruckhäuser / Kollbach
Discharge from 02.12.2018 to 01.12.2019
| Date | Mean value [m³/s] | Maximum [m³/s] | Minimum [m³/s] |
|---|---|---|---|
| 01.12.2019 | 0.738 | 0.805 | 0.692 |
| 30.11.2019 | 0.781 | 0.805 | 0.691 |
| 29.11.2019 | 0.72 | 0.746 | 0.691 |
| 28.11.2019 | 0.67 | 0.691 | 0.642 |
| 27.11.2019 | 0.716 | 0.805 | 0.642 |
| 26.11.2019 | 0.721 | 0.746 | 0.641 |
| 25.11.2019 | 0.684 | 0.745 | 0.641 |
© Bayerisches Landesamt für Umwelt 2024