
- Start >
- Rivers >
- Discharge >
- Untere Donau >
- Bruckhäuser >
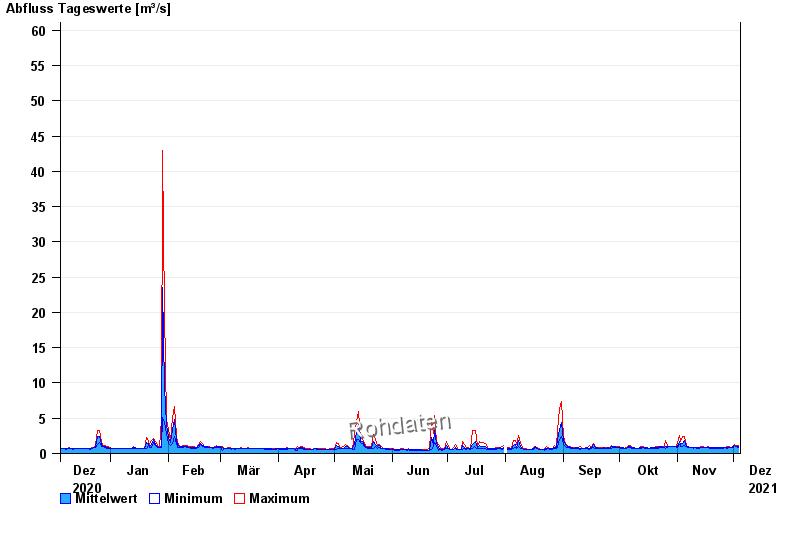
- Chart of year

Chart of year Bruckhäuser / Kollbach
Discharge from 05.12.2020 to 04.12.2021
- 13.01.2011 Abfluss: 134 m³/s
- 14.01.2004 Abfluss: 124 m³/s
- 12.02.2005 Abfluss: 86,3 m³/s
- 02.06.2013 Abfluss: 74,2 m³/s
- 11.11.2002 Abfluss: 71,7 m³/s
| Date | Mean value [m³/s] | Maximum [m³/s] | Minimum [m³/s] |
|---|---|---|---|
| 04.12.2021 | 0.932 | 1.09 | 0.803 |
| 03.12.2021 | 0.991 | 1.09 | 0.94 |
| 02.12.2021 | 1.18 | 1.27 | 1.09 |
| 01.12.2021 | 0.922 | 1.09 | 0.803 |
| 30.11.2021 | 0.814 | 0.867 | 0.803 |
| 29.11.2021 | 0.858 | 0.94 | 0.803 |
| 28.11.2021 | 0.809 | 0.94 | 0.745 |
© Bayerisches Landesamt für Umwelt 2024