
- Start >
- Rivers >
- Discharge >
- Untere Donau >
- Bruckhäuser >
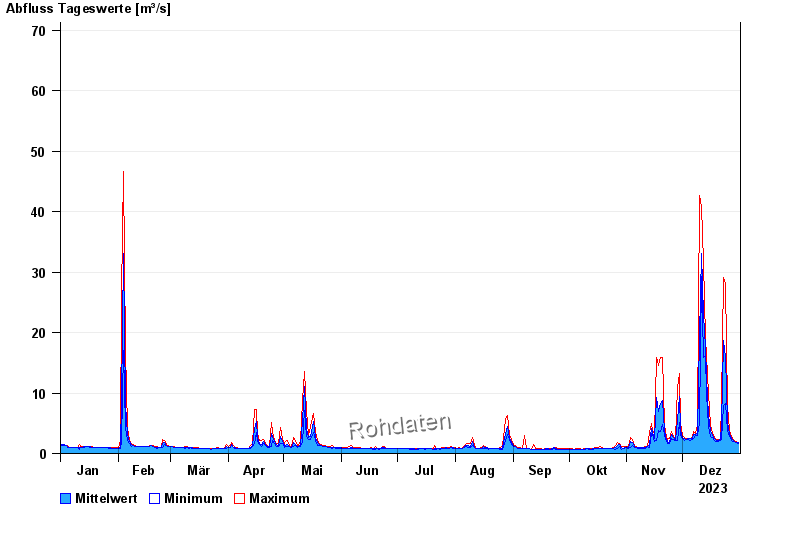
- Chart of year

Chart of year Bruckhäuser / Kollbach
Discharge from 01.01.2023 to 31.12.2023
- 13.01.2011 Abfluss: 134 m³/s
- 14.01.2004 Abfluss: 124 m³/s
- 12.02.2005 Abfluss: 86,3 m³/s
- 02.06.2013 Abfluss: 74,2 m³/s
- 11.11.2002 Abfluss: 71,7 m³/s
| Date | Mean value [m³/s] | Maximum [m³/s] | Minimum [m³/s] |
|---|---|---|---|
| 31.12.2023 | 1.79 | 1.8 | 1.67 |
| 30.12.2023 | 1.86 | 1.93 | 1.8 |
| 29.12.2023 | 1.95 | 2.05 | 1.93 |
| 28.12.2023 | 2.15 | 2.33 | 1.93 |
| 27.12.2023 | 2.5 | 2.77 | 2.19 |
| 26.12.2023 | 3.21 | 3.73 | 2.77 |
| 25.12.2023 | 5.36 | 8.01 | 3.73 |
© Bayerisches Landesamt für Umwelt 2024