
- Start >
- Rivers >
- Discharge >
- Untere Donau >
- Birnbach >
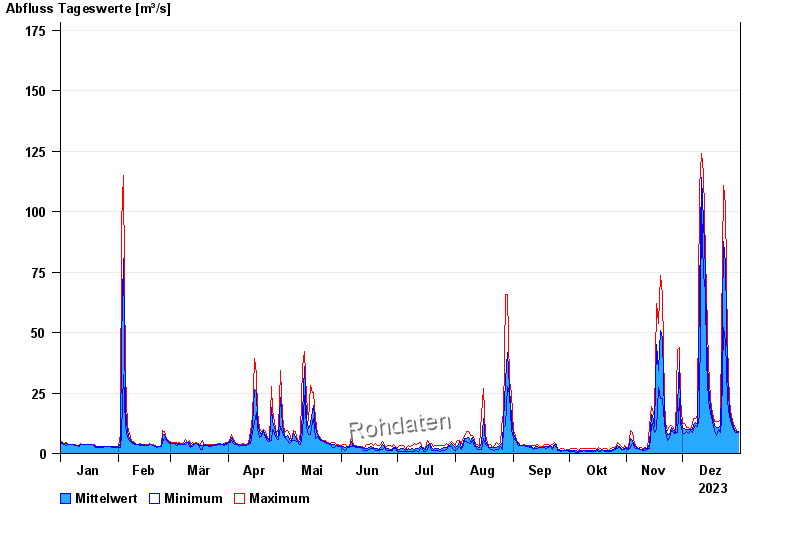
- Chart of year

Chart of year Birnbach / Rott
Discharge from 01.01.2023 to 31.12.2023
- 09.07.1954 Abfluss: 430 m³/s
- 02.08.1991 Abfluss: 307 m³/s
- 03.06.2013 Abfluss: 248 m³/s
- 23.02.1970 Abfluss: 248 m³/s
- 17.02.1958 Abfluss: 222 m³/s
| Date | Mean value [m³/s] | Maximum [m³/s] | Minimum [m³/s] |
|---|---|---|---|
| 31.12.2023 | 8.98 | 9.16 | 8.69 |
| 30.12.2023 | 9.25 | 9.65 | 8.69 |
| 29.12.2023 | 10.1 | 11.2 | 9.16 |
| 28.12.2023 | 11.2 | 12.2 | 10.1 |
| 27.12.2023 | 13.5 | 15.1 | 12.2 |
| 26.12.2023 | 17.8 | 21.5 | 15.1 |
| 25.12.2023 | 32.9 | 45.4 | 21.5 |
© Bayerisches Landesamt für Umwelt 2024