
- Start >
- Rivers >
- Discharge >
- Untere Donau >
- Birnbach >
- Chart of year

Chart of year Birnbach / Rott
Discharge from 01.01.2024 to 27.04.2024
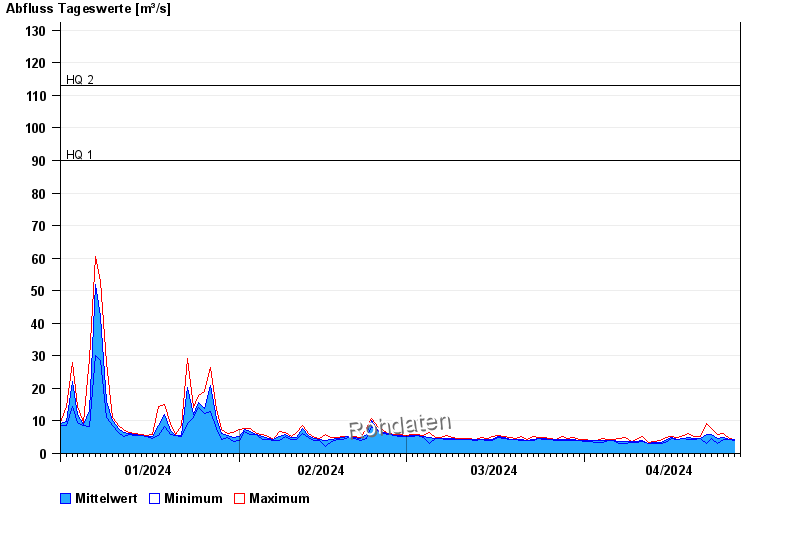
- HQ1 90 m³/s
- HQ2 113 m³/s
- HQ5 160 m³/s
- HQ10 200 m³/s
- HQ20 250 m³/s
- HQ50 337 m³/s
- HQ100 440 m³/s
| Date | Mean value [m³/s] | Maximum [m³/s] | Minimum [m³/s] |
|---|---|---|---|
| 27.04.2024 | 4.1 | 4.19 | 3.92 |
| 26.04.2024 | 4.21 | 4.48 | 4.19 |
| 25.04.2024 | 4.92 | 6.16 | 4.19 |
| 24.04.2024 | 4.66 | 5.8 | 2.97 |
| 23.04.2024 | 5.81 | 7.76 | 4.48 |
| 22.04.2024 | 5.76 | 9.16 | 3.18 |
| 21.04.2024 | 4.74 | 5.1 | 4.48 |
© Bayerisches Landesamt für Umwelt 2024