
- Start >
- Rivers >
- Discharge >
- Untere Donau >
- Berg >
- Chart of total period

Chart of total period Berg / Sempt
Discharge from 01.11.1961 to 03.05.2024
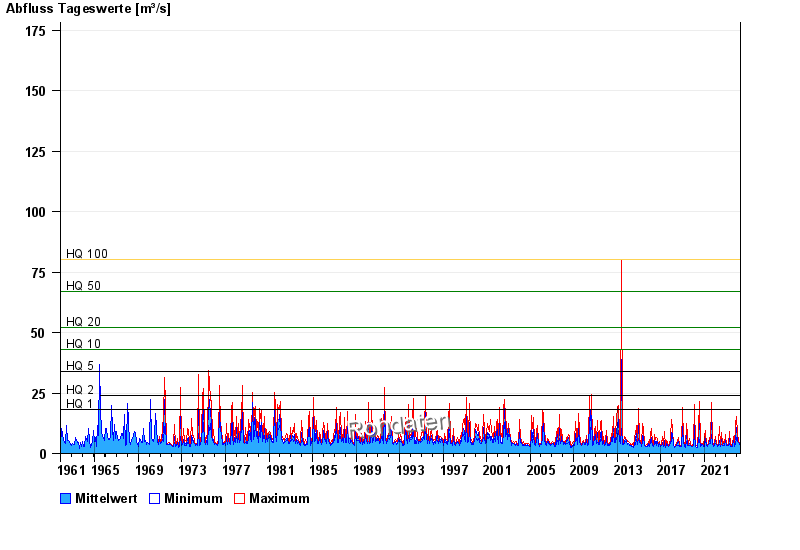
- HQ1 18 m³/s
- HQ2 24 m³/s
- HQ5 34 m³/s
- HQ10 43 m³/s
- HQ20 52 m³/s
- HQ50 67 m³/s
- HQ100 80 m³/s
| Date | Mean value [m³/s] | Maximum [m³/s] | Minimum [m³/s] |
|---|---|---|---|
| 03.05.2024 | 3.91 | 3.93 | 3.74 |
| 02.05.2024 | 3.87 | 3.93 | 3.84 |
| 01.05.2024 | 3.89 | 4.04 | 3.74 |
| 30.04.2024 | 3.88 | 3.93 | 3.84 |
| 29.04.2024 | 3.86 | 3.93 | 3.84 |
| 28.04.2024 | 3.9 | 3.93 | 3.84 |
| 27.04.2024 | 3.88 | 3.93 | 3.84 |
© Bayerisches Landesamt für Umwelt 2024