
- Start >
- Rivers >
- Discharge >
- Untere Donau >
- Auerbach >
- Chart of year

Chart of year Auerbach / Hengersberger Ohe
Discharge from 29.06.2022 to 28.06.2023
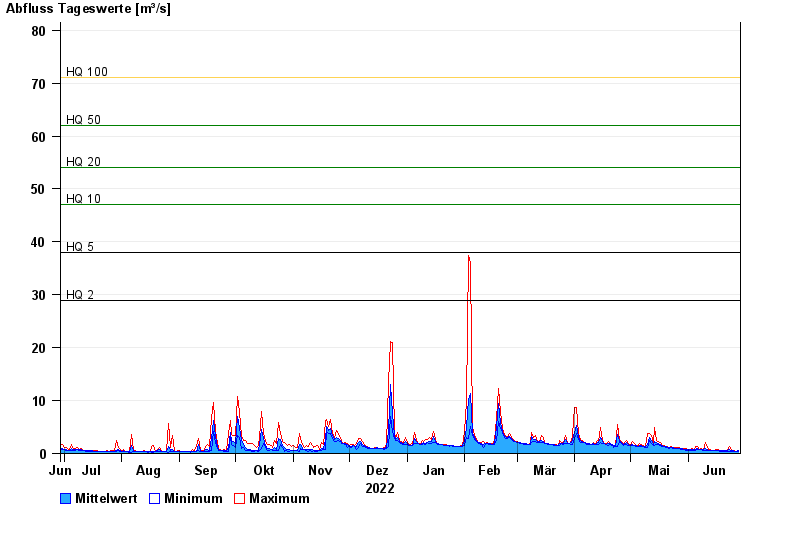
- HQ2 29 m³/s
- HQ5 38 m³/s
- HQ10 47 m³/s
- HQ20 54 m³/s
- HQ50 62 m³/s
- HQ100 71 m³/s
| Date | Mean value [m³/s] | Maximum [m³/s] | Minimum [m³/s] |
|---|---|---|---|
| 28.06.2023 | 0.478 | 0.631 | 0.392 |
| 27.06.2023 | 0.433 | 0.449 | 0.394 |
| 26.06.2023 | 0.454 | 0.508 | 0.397 |
| 25.06.2023 | 0.488 | 0.512 | 0.452 |
| 24.06.2023 | 0.572 | 0.645 | 0.454 |
| 23.06.2023 | 0.712 | 1.34 | 0.46 |
| 22.06.2023 | 0.502 | 0.583 | 0.361 |
© Bayerisches Landesamt für Umwelt 2024