
- Start >
- Rivers >
- Discharge >
- Untere Donau >
- Auerbach >
- Chart of year

Chart of year Auerbach / Hengersberger Ohe
Discharge from 14.07.2021 to 13.07.2022
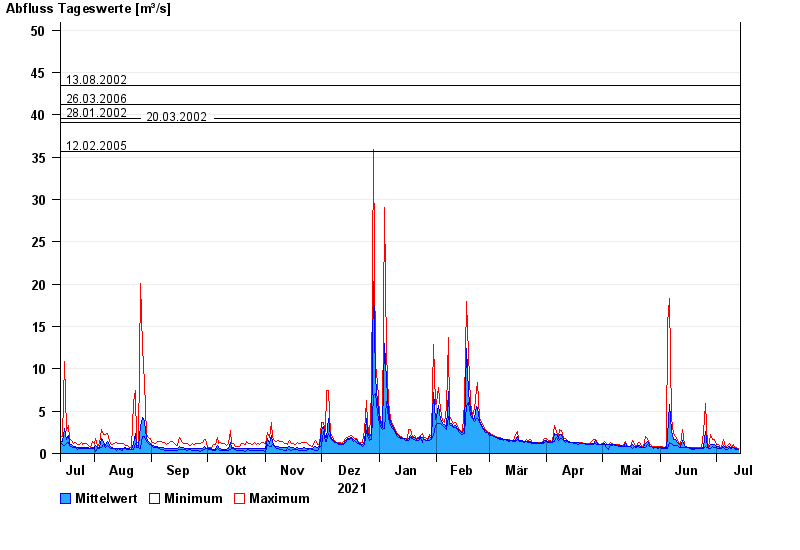
- 13.08.2002 Abfluss: 43,5 m³/s
- 26.03.2006 Abfluss: 41,2 m³/s
- 28.01.2002 Abfluss: 39,6 m³/s
- 20.03.2002 Abfluss: 39,1 m³/s
- 12.02.2005 Abfluss: 35,7 m³/s
| Date | Mean value [m³/s] | Maximum [m³/s] | Minimum [m³/s] |
|---|---|---|---|
| 13.07.2022 | 0.53 | 0.586 | 0.468 |
| 12.07.2022 | 0.585 | 0.653 | 0.525 |
| 11.07.2022 | 0.623 | 0.722 | 0.587 |
| 10.07.2022 | 0.76 | 1.03 | 0.654 |
| 09.07.2022 | 0.665 | 0.726 | 0.591 |
| 08.07.2022 | 0.823 | 1.19 | 0.726 |
| 07.07.2022 | 0.678 | 0.953 | 0.531 |
© Bayerisches Landesamt für Umwelt 2024