
- Start >
- Rivers >
- Discharge >
- Untere Donau >
- Auerbach >
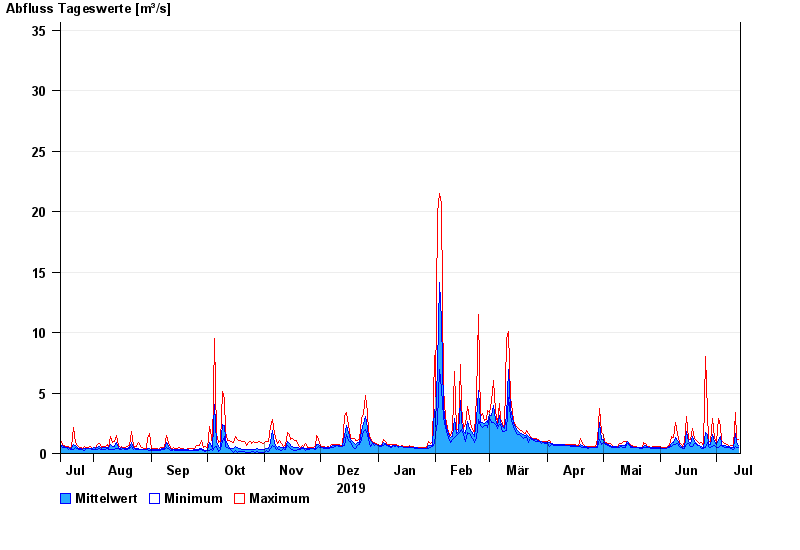
- Chart of year

Chart of year Auerbach / Hengersberger Ohe
Discharge from 14.07.2019 to 13.07.2020
- 13.08.2002 Abfluss: 43,5 m³/s
- 26.03.2006 Abfluss: 41,2 m³/s
- 28.01.2002 Abfluss: 39,6 m³/s
- 20.03.2002 Abfluss: 39,1 m³/s
- 12.02.2005 Abfluss: 35,7 m³/s
| Date | Mean value [m³/s] | Maximum [m³/s] | Minimum [m³/s] |
|---|---|---|---|
| 13.07.2020 | 0.663 | 1.12 | 0.534 |
| 12.07.2020 | 0.919 | 1.28 | 0.533 |
| 11.07.2020 | 1.65 | 3.42 | 0.594 |
| 10.07.2020 | 0.496 | 0.66 | 0.372 |
| 09.07.2020 | 0.524 | 0.659 | 0.422 |
| 08.07.2020 | 0.541 | 0.593 | 0.475 |
| 07.07.2020 | 0.576 | 0.728 | 0.531 |
© Bayerisches Landesamt für Umwelt 2024