
- Start >
- Rivers >
- Discharge >
- Untere Donau >
- Auerbach >
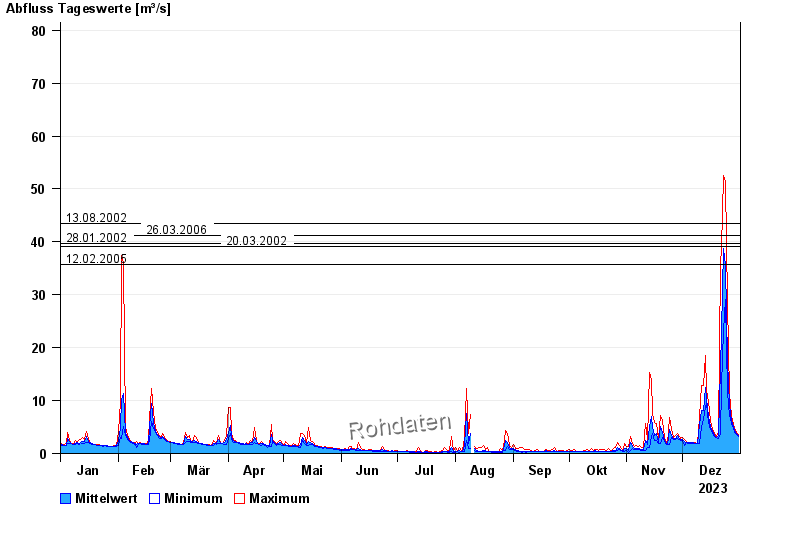
- Chart of year

Chart of year Auerbach / Hengersberger Ohe
Discharge from 01.01.2023 to 31.12.2023
- 16.03.2019 Abfluss: 53 m³/s
- 24.12.2018 Abfluss: 45,2 m³/s
- 13.01.2011 Abfluss: 44,3 m³/s
- 13.08.2002 Abfluss: 43,5 m³/s
- 10.01.2015 Abfluss: 41,9 m³/s
| Date | Mean value [m³/s] | Maximum [m³/s] | Minimum [m³/s] |
|---|---|---|---|
| 31.12.2023 | 3.35 | 3.51 | 3.2 |
| 30.12.2023 | 3.74 | 3.97 | 3.51 |
| 29.12.2023 | 4.3 | 4.69 | 3.97 |
| 28.12.2023 | 5.03 | 5.51 | 4.69 |
| 27.12.2023 | 6.29 | 7.25 | 5.59 |
| 26.12.2023 | 9.01 | 11.4 | 7.25 |
| 25.12.2023 | 17.6 | 28.5 | 11.5 |
© Bayerisches Landesamt für Umwelt 2025