
- Start >
- Rivers >
- Discharge >
- Untere Donau >
- Auerbach >
- Chart of year

Chart of year Auerbach / Hengersberger Ohe
Discharge from 16.08.2020 to 15.08.2021
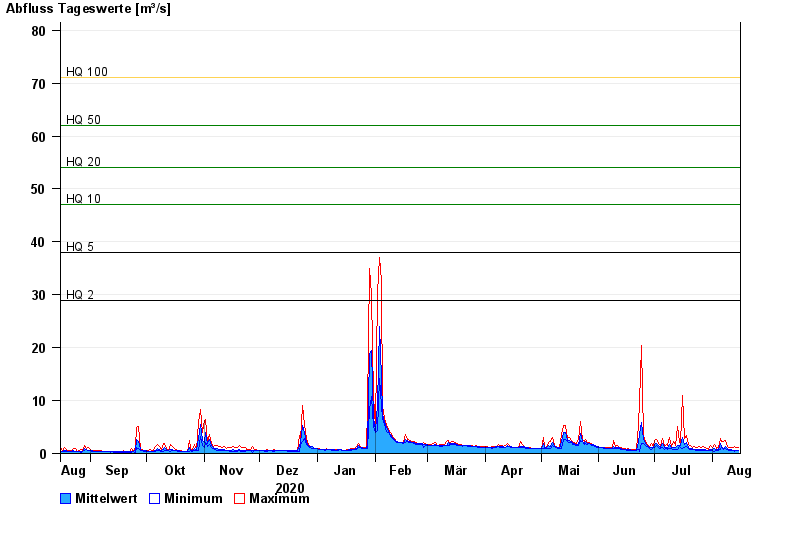
- HQ2 29 m³/s
- HQ5 38 m³/s
- HQ10 47 m³/s
- HQ20 54 m³/s
- HQ50 62 m³/s
- HQ100 71 m³/s
| Date | Mean value [m³/s] | Maximum [m³/s] | Minimum [m³/s] |
|---|---|---|---|
| 15.08.2021 | 0.574 | 1.21 | 0.48 |
| 14.08.2021 | 0.62 | 1.21 | 0.537 |
| 13.08.2021 | 0.628 | 1.28 | 0.377 |
| 12.08.2021 | 0.644 | 1.2 | 0.536 |
| 11.08.2021 | 0.682 | 1.12 | 0.536 |
| 10.08.2021 | 0.773 | 1.2 | 0.601 |
| 09.08.2021 | 0.976 | 1.36 | 0.735 |
© Bayerisches Landesamt für Umwelt 2024