
- Start >
- Rivers >
- Discharge >
- Untere Donau >
- Auerbach >
- Chart of year

Chart of year Auerbach / Hengersberger Ohe
Discharge from 04.08.2020 to 03.08.2021
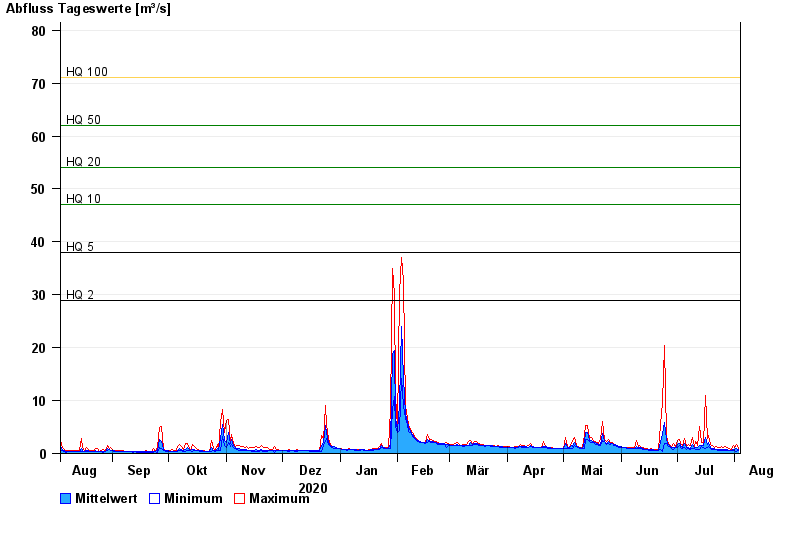
- HQ2 29 m³/s
- HQ5 38 m³/s
- HQ10 47 m³/s
- HQ20 54 m³/s
- HQ50 62 m³/s
- HQ100 71 m³/s
| Date | Mean value [m³/s] | Maximum [m³/s] | Minimum [m³/s] |
|---|---|---|---|
| 03.08.2021 | 0.672 | 0.881 | 0.533 |
| 02.08.2021 | 0.973 | 1.75 | 0.29 |
| 01.08.2021 | 0.744 | 1.21 | 0.541 |
| 31.07.2021 | 0.734 | 1.45 | 0.542 |
| 30.07.2021 | 0.581 | 0.749 | 0.547 |
| 29.07.2021 | 0.66 | 0.907 | 0.551 |
| 28.07.2021 | 0.695 | 1.15 | 0.558 |
© Bayerisches Landesamt für Umwelt 2024