
- Start >
- Rivers >
- Discharge >
- Untere Donau >
- Auerbach >
- Chart of year

Chart of year Auerbach / Hengersberger Ohe
Discharge from 01.01.2024 to 26.04.2024
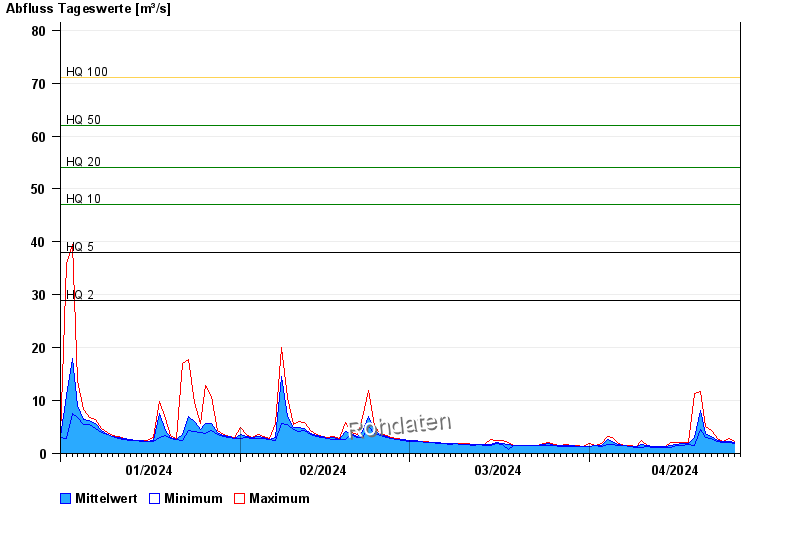
- HQ2 29 m³/s
- HQ5 38 m³/s
- HQ10 47 m³/s
- HQ20 54 m³/s
- HQ50 62 m³/s
- HQ100 71 m³/s
| Date | Mean value [m³/s] | Maximum [m³/s] | Minimum [m³/s] |
|---|---|---|---|
| 26.04.2024 | 2.09 | 2.29 | 1.99 |
| 25.04.2024 | 2.26 | 2.75 | 1.99 |
| 24.04.2024 | 2.21 | 2.29 | 2.06 |
| 23.04.2024 | 2.49 | 2.75 | 2.29 |
| 22.04.2024 | 3.21 | 4.3 | 2.75 |
| 21.04.2024 | 3.87 | 5.1 | 3.05 |
| 20.04.2024 | 8.17 | 11.8 | 4.62 |
© Bayerisches Landesamt für Umwelt 2024