
- Start >
- Rivers >
- Discharge >
- Untere Donau >
- Arzberg >
- Chart of year

Chart of year Arzberg / Röslau
Discharge from 29.01.2020 to 28.01.2021
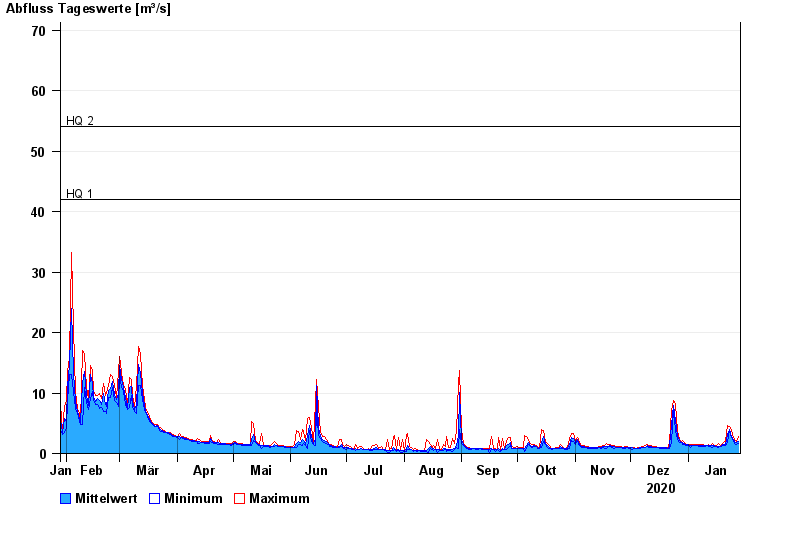
- HQ1 42 m³/s
- HQ2 54 m³/s
- HQ5 75 m³/s
- HQ10 90 m³/s
- HQ20 105 m³/s
- HQ50 124 m³/s
- HQ100 140 m³/s
| Date | Mean value [m³/s] | Maximum [m³/s] | Minimum [m³/s] |
|---|---|---|---|
| 28.01.2021 | 1.91 | 2.67 | 1.65 |
| 27.01.2021 | 1.84 | 1.97 | 1.44 |
| 26.01.2021 | 2 | 2.31 | 1.65 |
| 25.01.2021 | 2.32 | 2.67 | 2.08 |
| 24.01.2021 | 2.85 | 3.72 | 2.67 |
| 23.01.2021 | 3.96 | 4.33 | 3.72 |
| 22.01.2021 | 3.06 | 4.49 | 1.86 |
© Bayerisches Landesamt für Umwelt 2024