
- Start >
- Rivers >
- Discharge >
- Untere Donau >
- Arzberg >
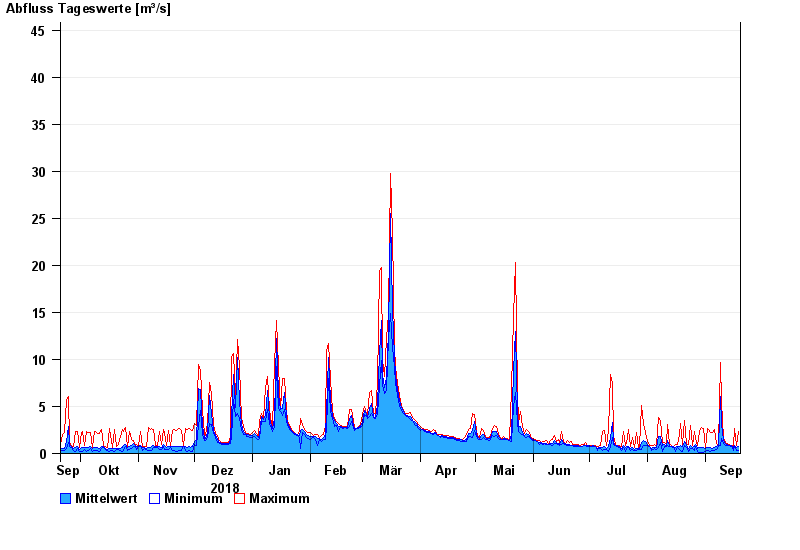
- Chart of year

Chart of year Arzberg / Röslau
Discharge from 20.09.2018 to 19.09.2019
- 01.09.1977 Abfluss: 89 m³/s
- 01.11.1998 Abfluss: 84,2 m³/s
- 06.01.1982 Abfluss: 82,9 m³/s
- 28.05.2006 Abfluss: 81,6 m³/s
- 06.02.1980 Abfluss: 80,5 m³/s
| Date | Mean value [m³/s] | Maximum [m³/s] | Minimum [m³/s] |
|---|---|---|---|
| 19.09.2019 | 0.68 | 2.31 | 0.281 |
| 18.09.2019 | 0.578 | 0.786 | 0.298 |
| 17.09.2019 | 0.845 | 2.67 | 0.657 |
| 16.09.2019 | 0.608 | 0.786 | 0.266 |
| 15.09.2019 | 0.786 | 0.855 | 0.721 |
| 14.09.2019 | 0.845 | 0.931 | 0.786 |
| 13.09.2019 | 0.883 | 1.01 | 0.786 |
© Bayerisches Landesamt für Umwelt 2024