
- Start >
- Rivers >
- Discharge >
- Untere Donau >
- Arzberg >
- Chart of year

Chart of year Arzberg / Röslau
Discharge from 01.01.2023 to 31.12.2023
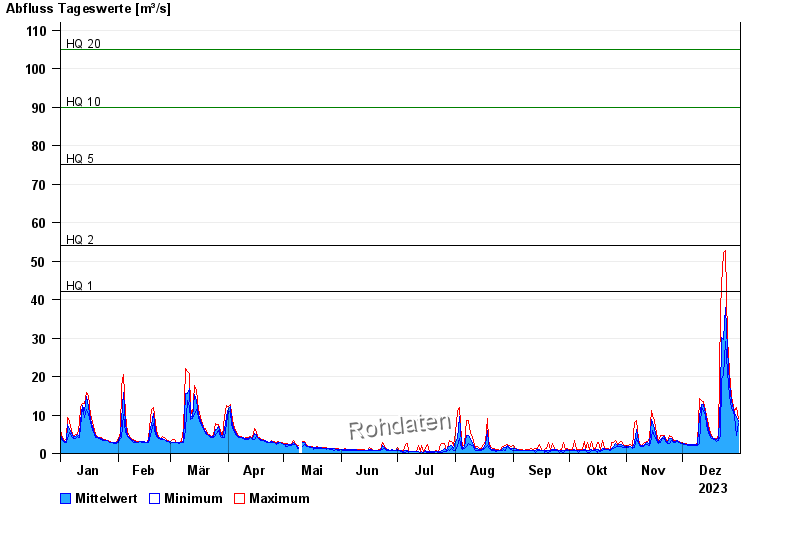
- HQ1 42 m³/s
- HQ2 54 m³/s
- HQ5 75 m³/s
- HQ10 90 m³/s
- HQ20 105 m³/s
- HQ50 124 m³/s
- HQ100 140 m³/s
| Date | Mean value [m³/s] | Maximum [m³/s] | Minimum [m³/s] |
|---|---|---|---|
| 31.12.2023 | 8.35 | 9.19 | 7.86 |
| 30.12.2023 | 9.25 | 11.9 | 4.76 |
| 29.12.2023 | 10.4 | 11 | 9.52 |
| 28.12.2023 | 11.4 | 12.3 | 10.6 |
| 27.12.2023 | 13.4 | 14.9 | 11.9 |
| 26.12.2023 | 18.1 | 21.4 | 14.7 |
| 25.12.2023 | 27 | 29.8 | 21.4 |
© Bayerisches Landesamt für Umwelt 2024