
- Start >
- Rivers >
- Discharge >
- Untere Donau >
- Appolding >
- Chart of year

Chart of year Appolding / Strogen
Discharge from 01.11.2020 to 31.10.2021
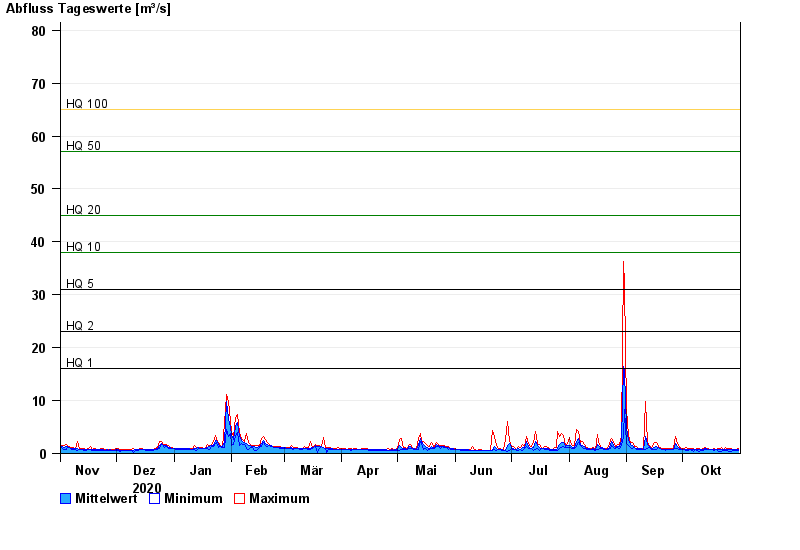
- HQ1 16 m³/s
- HQ2 23 m³/s
- HQ5 31 m³/s
- HQ10 38 m³/s
- HQ20 45 m³/s
- HQ50 57 m³/s
- HQ100 65 m³/s
| Date | Mean value [m³/s] | Maximum [m³/s] | Minimum [m³/s] |
|---|---|---|---|
| 31.10.2021 | 0.704 | 0.898 | 0.544 |
| 30.10.2021 | 0.694 | 0.807 | 0.553 |
| 29.10.2021 | 0.722 | 0.824 | 0.531 |
| 28.10.2021 | 0.712 | 0.824 | 0.643 |
| 27.10.2021 | 0.676 | 0.88 | 0.47 |
| 26.10.2021 | 0.672 | 0.951 | 0.45 |
| 25.10.2021 | 0.717 | 0.969 | 0.565 |
© Bayerisches Landesamt für Umwelt 2024