
- Start >
- Rivers >
- Discharge >
- Untere Donau >
- Appolding >
- Chart of year

Chart of year Appolding / Strogen
Discharge from 01.01.2023 to 31.12.2023
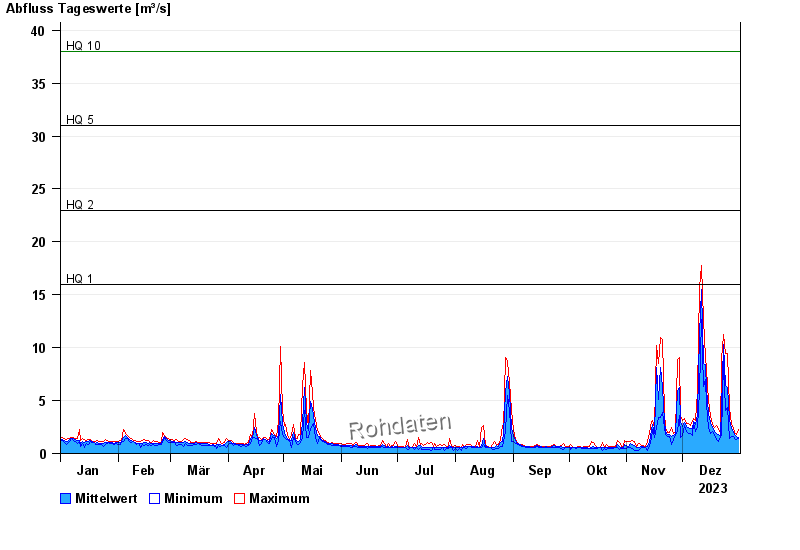
- HQ1 16 m³/s
- HQ2 23 m³/s
- HQ5 31 m³/s
- HQ10 38 m³/s
- HQ20 45 m³/s
- HQ50 57 m³/s
- HQ100 65 m³/s
| Date | Mean value [m³/s] | Maximum [m³/s] | Minimum [m³/s] |
|---|---|---|---|
| 31.12.2023 | 1.55 | 2.27 | 1.4 |
| 30.12.2023 | 1.59 | 1.76 | 1.32 |
| 29.12.2023 | 1.77 | 1.96 | 1.4 |
| 28.12.2023 | 2.02 | 2.5 | 1.57 |
| 27.12.2023 | 2.35 | 2.75 | 1.57 |
| 26.12.2023 | 3.25 | 4.33 | 1.4 |
| 25.12.2023 | 6.21 | 9.45 | 4.33 |
© Bayerisches Landesamt für Umwelt 2024