
- Start >
- Rivers >
- Discharge >
- Untere Donau >
- Appolding >
- Chart of year

Chart of year Appolding / Strogen
Discharge from 01.01.2019 to 31.12.2019
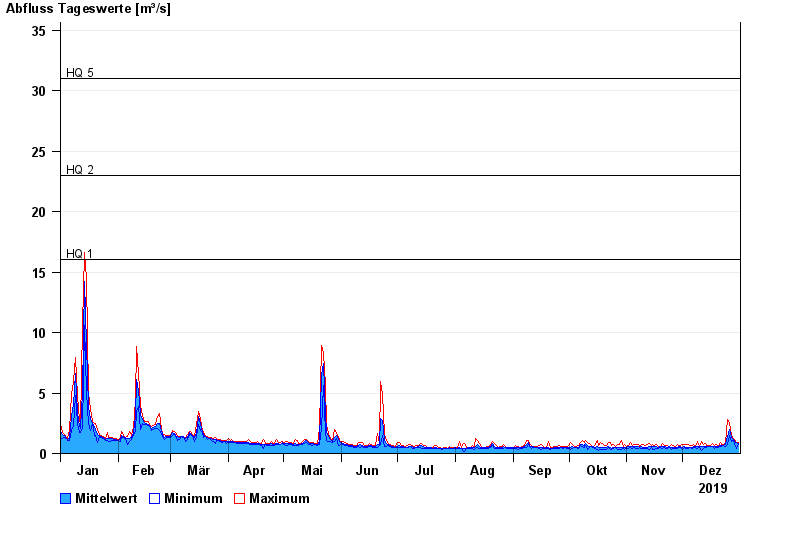
- HQ1 16 m³/s
- HQ2 23 m³/s
- HQ5 31 m³/s
- HQ10 38 m³/s
- HQ20 45 m³/s
- HQ50 57 m³/s
- HQ100 65 m³/s
| Date | Mean value [m³/s] | Maximum [m³/s] | Minimum [m³/s] |
|---|---|---|---|
| 31.12.2019 | 0.836 | 0.905 | 0.781 |
| 30.12.2019 | 0.893 | 0.936 | 0.382 |
| 29.12.2019 | 1.02 | 1.17 | 0.84 |
| 28.12.2019 | 1.22 | 1.34 | 1.11 |
| 27.12.2019 | 1.36 | 1.61 | 1.03 |
| 26.12.2019 | 2.1 | 2.7 | 1.59 |
| 25.12.2019 | 1.45 | 3.02 | 0.772 |
© Bayerisches Landesamt für Umwelt 2024