
- Start >
- Rivers >
- Discharge >
- Untere Donau >
- Aham >
- Chart of year

Chart of year Aham / Vils
Discharge from 30.05.2021 to 29.05.2022
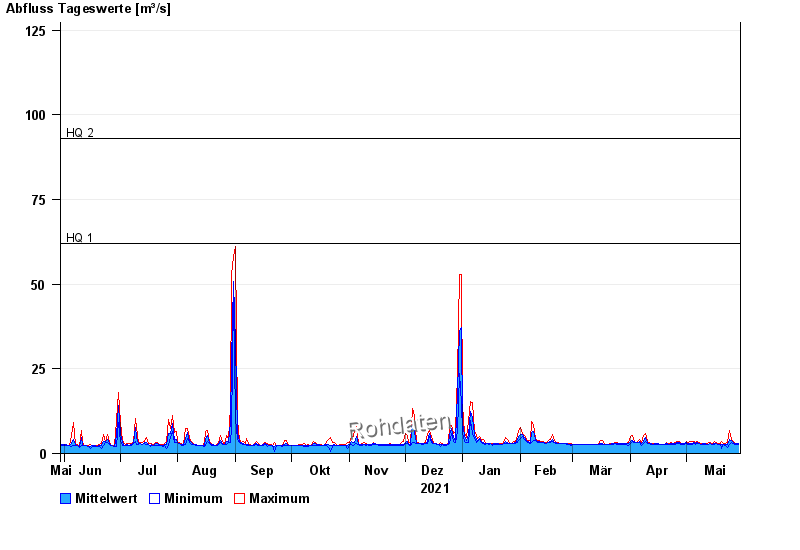
- HQ1 62 m³/s
- HQ2 93 m³/s
- HQ5 130 m³/s
- HQ10 165 m³/s
- HQ20 195 m³/s
- HQ50 243 m³/s
- HQ100 280 m³/s
| Date | Mean value [m³/s] | Maximum [m³/s] | Minimum [m³/s] |
|---|---|---|---|
| 29.05.2022 | 2.84 | 3.08 | 2.71 |
| 28.05.2022 | 2.81 | 3.08 | 2.59 |
| 27.05.2022 | 2.87 | 3.08 | 2.59 |
| 26.05.2022 | 3.22 | 3.47 | 2.83 |
| 25.05.2022 | 3.81 | 4.02 | 3.34 |
| 24.05.2022 | 4.19 | 6.86 | 2.71 |
| 23.05.2022 | 2.68 | 3.21 | 1.81 |
© Bayerisches Landesamt für Umwelt 2024