
- Start >
- Rivers >
- Discharge >
- Untere Donau >
- Aham >
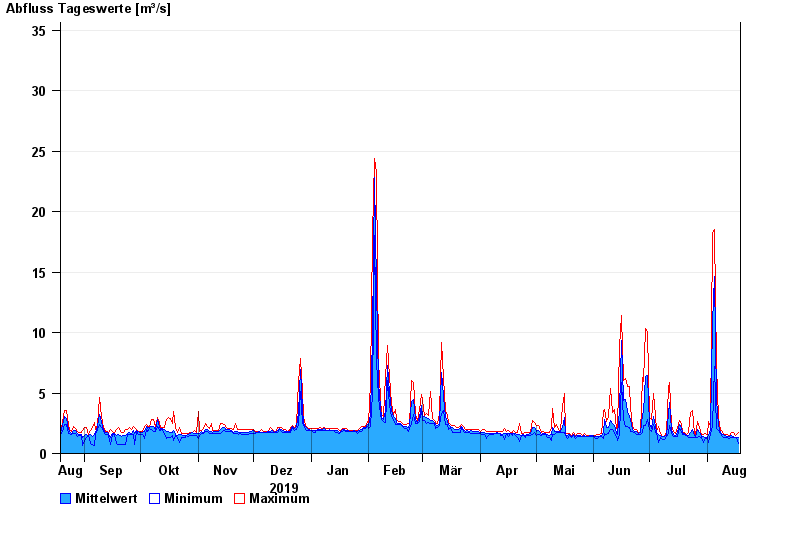
- Chart of year

Chart of year Aham / Vils
Discharge from 19.08.2019 to 18.08.2020
- 03.06.2013 Abfluss: 231 m³/s
- 01.02.1985 Abfluss: 197 m³/s
- 04.08.1991 Abfluss: 196 m³/s
- 22.02.1970 Abfluss: 194 m³/s
- 20.02.1999 Abfluss: 176 m³/s
| Date | Mean value [m³/s] | Maximum [m³/s] | Minimum [m³/s] |
|---|---|---|---|
| 18.08.2020 | 1.31 | 1.7 | 0.843 |
| 17.08.2020 | 1.36 | 1.57 | 1.31 |
| 16.08.2020 | 1.32 | 1.45 | 1.32 |
| 15.08.2020 | 1.43 | 1.72 | 1.32 |
| 14.08.2020 | 1.49 | 1.72 | 1.33 |
| 13.08.2020 | 1.42 | 1.47 | 1.22 |
| 12.08.2020 | 1.44 | 1.6 | 1.35 |
© Bayerisches Landesamt für Umwelt 2024