
- Start >
- Rivers >
- Discharge >
- Untere Donau >
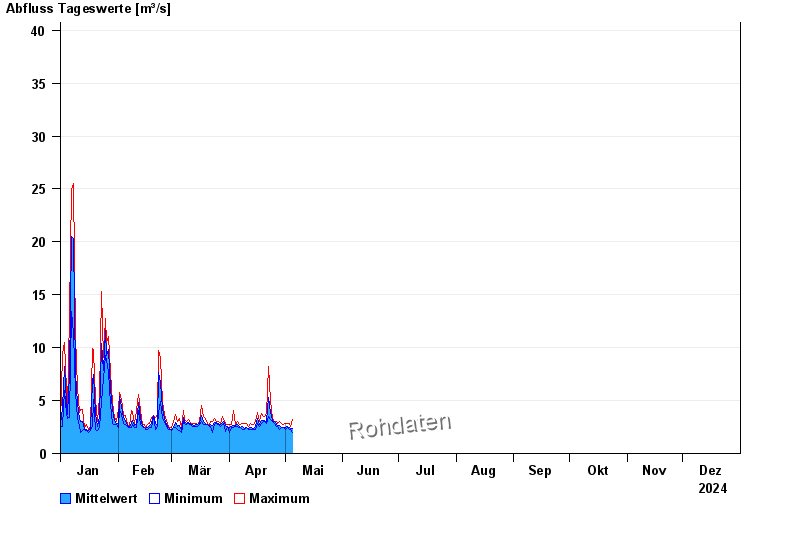
- Aham >
- Chart of year

Chart of year Aham / Vils
Discharge from 01.01.2024 to 31.12.2024
- 03.06.2013 Abfluss: 231 m³/s
- 04.08.1991 Abfluss: 196 m³/s
- 22.02.1970 Abfluss: 178 m³/s
- 20.02.1999 Abfluss: 176 m³/s
- 31.01.1982 Abfluss: 172 m³/s
| Date | Mean value [m³/s] | Maximum [m³/s] | Minimum [m³/s] |
|---|---|---|---|
| 31.12.2024 | 3.06 | 3.15 | 2.68 |
| 30.12.2024 | 3.16 | 3.3 | 3.15 |
| 29.12.2024 | 3.29 | 3.46 | 3.15 |
| 28.12.2024 | 3.38 | 3.46 | 3.3 |
| 27.12.2024 | 3.55 | 4.06 | 3.46 |
| 26.12.2024 | 3.84 | 4.37 | 3.46 |
| 25.12.2024 | 5.1 | 6.48 | 4.37 |
© Bayerisches Landesamt für Umwelt 2025