
- Start >
- Rivers >
- Discharge >
- Untere Donau >
- Aham >
- Chart of year

Chart of year Aham / Vils
Discharge from 30.05.2023 to 29.05.2024
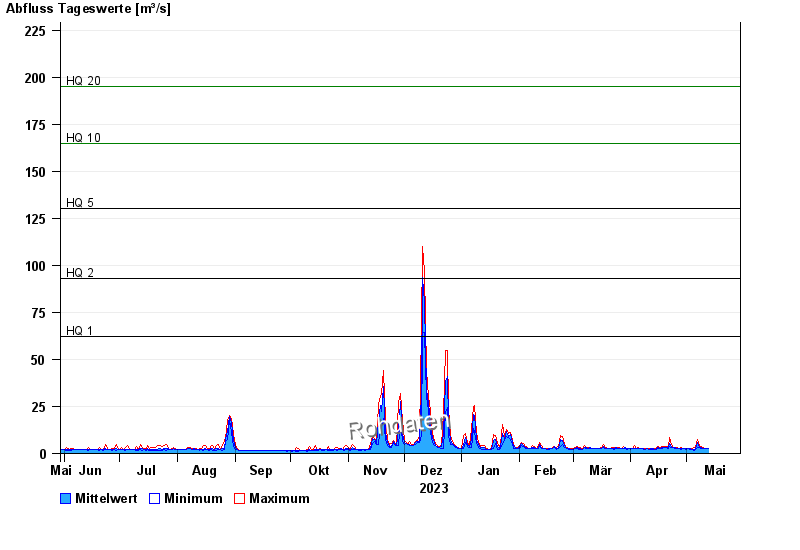
- HQ1 62 m³/s
- HQ2 93 m³/s
- HQ5 130 m³/s
- HQ10 165 m³/s
- HQ20 195 m³/s
- HQ50 243 m³/s
- HQ100 280 m³/s
| Date | Mean value [m³/s] | Maximum [m³/s] | Minimum [m³/s] |
|---|---|---|---|
| 23.05.2024 | 3.13 | 3.76 | 2.72 |
| 22.05.2024 | 3.15 | 4.84 | 2.41 |
| 21.05.2024 | 2.32 | 2.41 | 2.1 |
| 20.05.2024 | 2.73 | 3.02 | 2.41 |
| 19.05.2024 | 2.77 | 3.02 | 2.57 |
| 18.05.2024 | 2.91 | 3.31 | 2.57 |
| 17.05.2024 | 2.66 | 3.02 | 2.1 |
© Bayerisches Landesamt für Umwelt 2024