
- Start >
- Rivers >
- Discharge >
- Untere Donau >
- Aham >
- Chart of year

Chart of year Aham / Vils
Discharge from 01.01.2023 to 31.12.2023
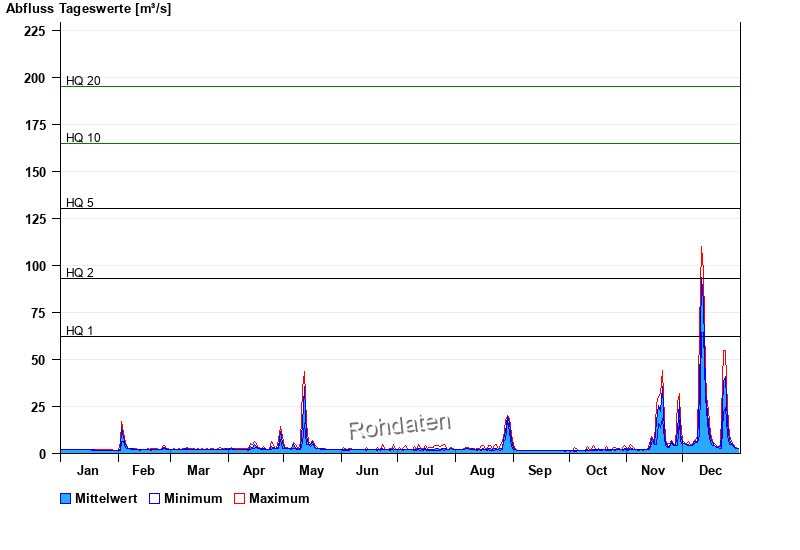
- HQ1 62 m³/s
- HQ2 93 m³/s
- HQ5 130 m³/s
- HQ10 165 m³/s
- HQ20 195 m³/s
- HQ50 243 m³/s
- HQ100 280 m³/s
| Date | Mean value [m³/s] | Maximum [m³/s] | Minimum [m³/s] |
|---|---|---|---|
| 31.12.2023 | 2.64 | 2.71 | 2.57 |
| 30.12.2023 | 2.92 | 3.13 | 2.71 |
| 29.12.2023 | 3.5 | 3.72 | 3.13 |
| 28.12.2023 | 4.18 | 4.79 | 3.57 |
| 27.12.2023 | 5.52 | 6.61 | 4.79 |
| 26.12.2023 | 7.03 | 9.49 | 4.64 |
| 25.12.2023 | 16.7 | 24.1 | 9.7 |
© Bayerisches Landesamt für Umwelt 2025