
- Start >
- Rivers >
- Discharge >
- Naab - Regen >
- Windischeschenbach >
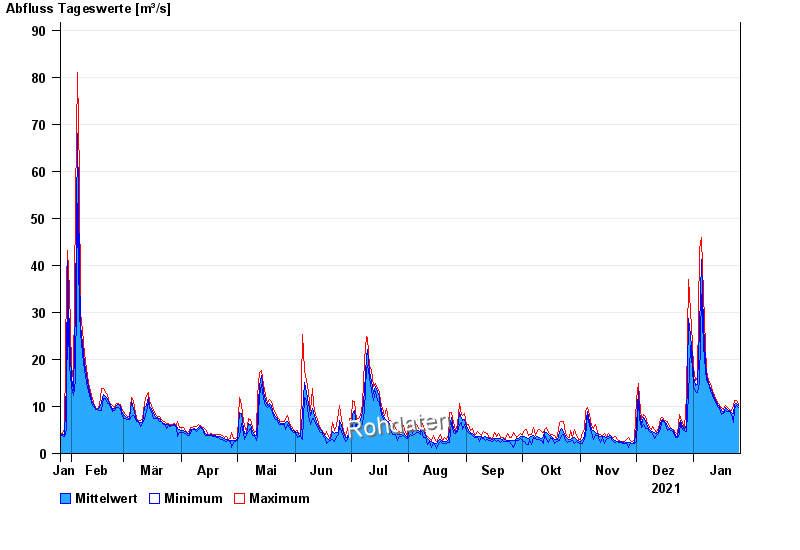
- Chart of year

Chart of year Windischeschenbach / Waldnaab
Discharge from 26.01.2021 to 25.01.2022
| Date | Mean value [m³/s] | Maximum [m³/s] | Minimum [m³/s] |
|---|---|---|---|
| 25.01.2022 | 10.1 | 10.4 | 9.74 |
| 24.01.2022 | 10.7 | 11.3 | 10.1 |
| 23.01.2022 | 10.5 | 11.3 | 9.45 |
| 22.01.2022 | 8.55 | 10.1 | 6.65 |
| 21.01.2022 | 8.68 | 9.17 | 8.32 |
| 20.01.2022 | 9.1 | 9.45 | 8.88 |
| 19.01.2022 | 9.25 | 9.74 | 8.88 |
© Bayerisches Landesamt für Umwelt 2024