
- Start >
- Rivers >
- Discharge >
- Naab - Regen >
- Windischeschenbach >
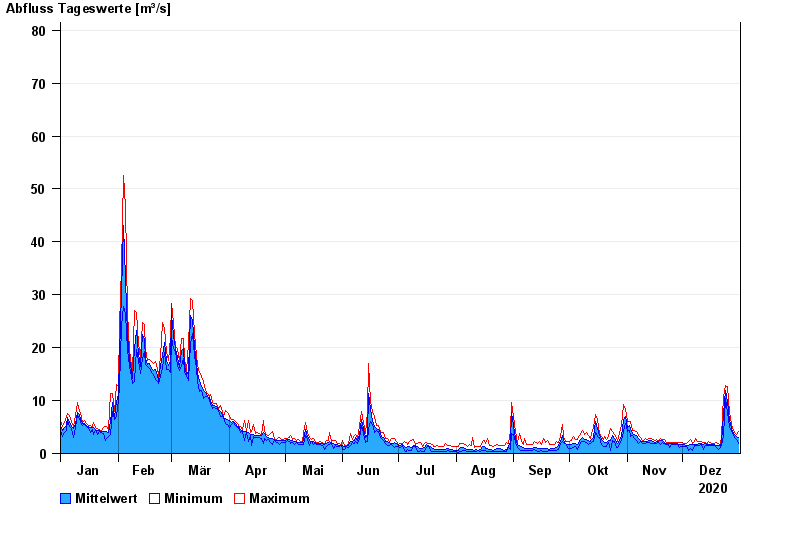
- Chart of year

Chart of year Windischeschenbach / Waldnaab
Discharge from 01.01.2020 to 31.12.2020
- 30.12.1986 Abfluss: 153 m³/s
- 26.01.1995 Abfluss: 144 m³/s
- 14.01.2011 Abfluss: 129 m³/s
- 28.01.2002 Abfluss: 124 m³/s
- 06.02.1980 Abfluss: 120 m³/s
| Date | Mean value [m³/s] | Maximum [m³/s] | Minimum [m³/s] |
|---|---|---|---|
| 31.12.2020 | 2.94 | 4.07 | 1.9 |
| 30.12.2020 | 3.18 | 3.68 | 2.63 |
| 29.12.2020 | 3.51 | 3.88 | 2.96 |
| 28.12.2020 | 3.82 | 4.29 | 3.32 |
| 27.12.2020 | 4.65 | 5.42 | 4.09 |
| 26.12.2020 | 6.33 | 7.79 | 5.18 |
| 25.12.2020 | 9.9 | 12.6 | 7.79 |
© Bayerisches Landesamt für Umwelt 2024