
- Start >
- Rivers >
- Discharge >
- Naab - Regen >
- Windischeschenbach >
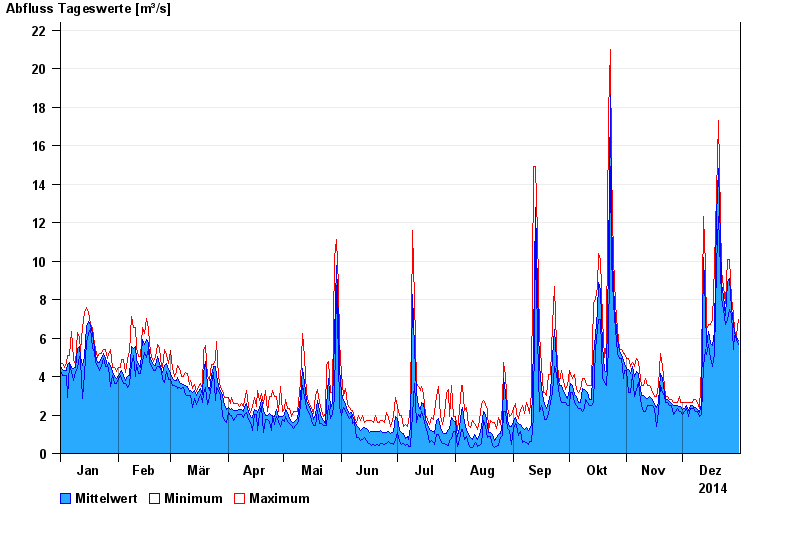
- Chart of year

Chart of year Windischeschenbach / Waldnaab
Discharge from 01.01.2014 to 31.12.2014
| Date | Mean value [m³/s] | Maximum [m³/s] | Minimum [m³/s] |
|---|---|---|---|
| 31.12.2014 | 5.86 | 6.94 | 5.64 |
| 30.12.2014 | 6.04 | 6.15 | 5.92 |
| 29.12.2014 | 6.27 | 6.38 | 6.15 |
| 28.12.2014 | 6.73 | 7.22 | 5.4 |
| 27.12.2014 | 7.55 | 8.05 | 7.22 |
| 26.12.2014 | 9.07 | 10.1 | 7.49 |
| 25.12.2014 | 8.89 | 10.1 | 6.95 |
© Bayerisches Landesamt für Umwelt 2024