
- Start >
- Rivers >
- Discharge >
- Naab - Regen >
- Windischeschenbach >
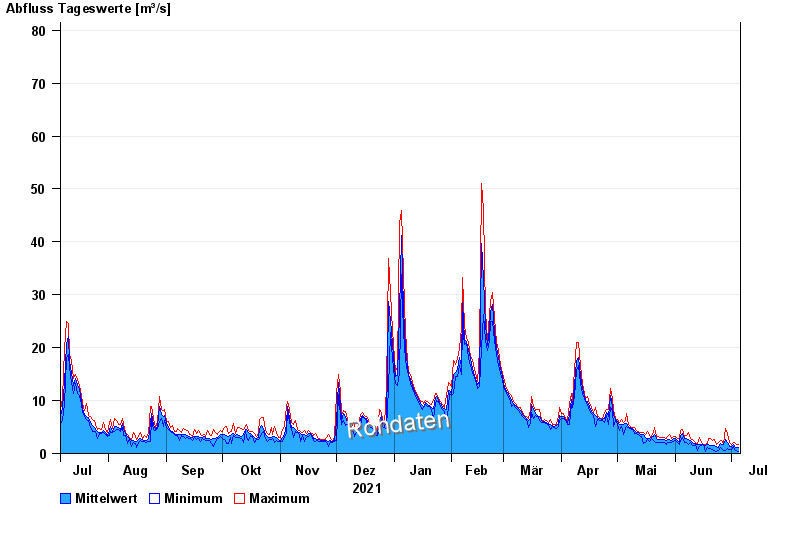
- Chart of year

Chart of year Windischeschenbach / Waldnaab
Discharge from 06.07.2021 to 05.07.2022
- 30.12.1986 Abfluss: 153 m³/s
- 26.01.1995 Abfluss: 144 m³/s
- 14.01.2011 Abfluss: 129 m³/s
- 28.01.2002 Abfluss: 124 m³/s
- 06.02.1980 Abfluss: 120 m³/s
| Date | Mean value [m³/s] | Maximum [m³/s] | Minimum [m³/s] |
|---|---|---|---|
| 05.07.2022 | 1.17 | 1.76 | 0.454 |
| 04.07.2022 | 1.22 | 1.76 | 0.569 |
| 03.07.2022 | 1.38 | 2.03 | 0.71 |
| 02.07.2022 | 1.67 | 2.03 | 1.39 |
| 01.07.2022 | 1.4 | 1.76 | 0.792 |
| 30.06.2022 | 1.38 | 2.03 | 0.71 |
| 29.06.2022 | 2.06 | 3.7 | 0.881 |
© Bayerisches Landesamt für Umwelt 2024