
- Start >
- Rivers >
- Discharge >
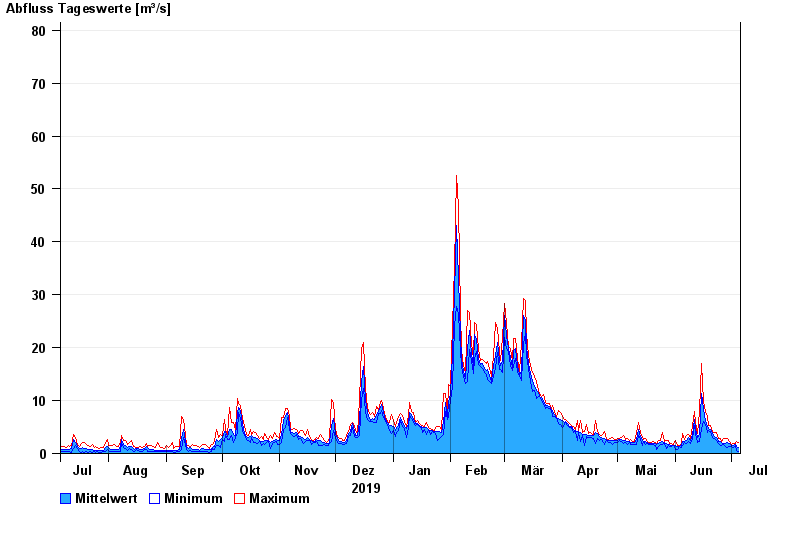
- Naab - Regen >
- Windischeschenbach >
- Chart of year

Chart of year Windischeschenbach / Waldnaab
Discharge from 06.07.2019 to 05.07.2020
- 30.12.1986 Abfluss: 153 m³/s
- 26.01.1995 Abfluss: 144 m³/s
- 14.01.2011 Abfluss: 129 m³/s
- 28.01.2002 Abfluss: 124 m³/s
- 06.02.1980 Abfluss: 120 m³/s
| Date | Mean value [m³/s] | Maximum [m³/s] | Minimum [m³/s] |
|---|---|---|---|
| 05.07.2020 | 1.12 | 2.09 | 0.348 |
| 04.07.2020 | 1.34 | 2.34 | 0.526 |
| 03.07.2020 | 1.68 | 1.9 | 1.56 |
| 02.07.2020 | 1.59 | 1.96 | 1.2 |
| 01.07.2020 | 1.53 | 1.73 | 1.33 |
| 30.06.2020 | 1.82 | 2.27 | 1.38 |
| 29.06.2020 | 1.99 | 2.91 | 1.09 |
© Bayerisches Landesamt für Umwelt 2024