
- Start >
- Rivers >
- Discharge >
- Naab - Regen >
- Windischeschenbach >
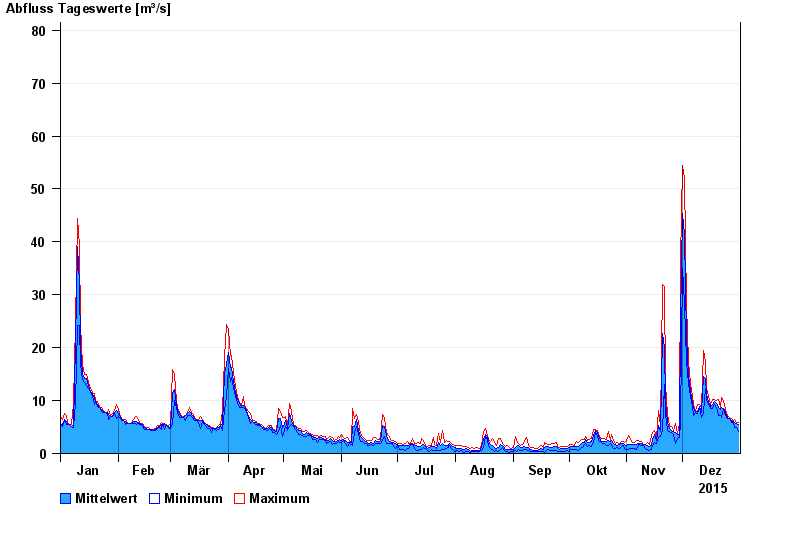
- Chart of year

Chart of year Windischeschenbach / Waldnaab
Discharge from 01.01.2015 to 31.12.2015
- 30.12.1986 Abfluss: 153 m³/s
- 26.01.1995 Abfluss: 144 m³/s
- 14.01.2011 Abfluss: 129 m³/s
- 28.01.2002 Abfluss: 124 m³/s
- 06.02.1980 Abfluss: 120 m³/s
| Date | Mean value [m³/s] | Maximum [m³/s] | Minimum [m³/s] |
|---|---|---|---|
| 31.12.2015 | 5.39 | 5.87 | 4.07 |
| 30.12.2015 | 5.7 | 5.87 | 4.92 |
| 29.12.2015 | 5.8 | 6.37 | 4.91 |
| 28.12.2015 | 5.98 | 6.11 | 5.85 |
| 27.12.2015 | 6.31 | 6.61 | 5.84 |
| 26.12.2015 | 6.62 | 6.87 | 6.6 |
| 25.12.2015 | 6.89 | 7.13 | 6.6 |
© Bayerisches Landesamt für Umwelt 2024