
- Start >
- Rivers >
- Discharge >
- Naab - Regen >
- Wildenau >
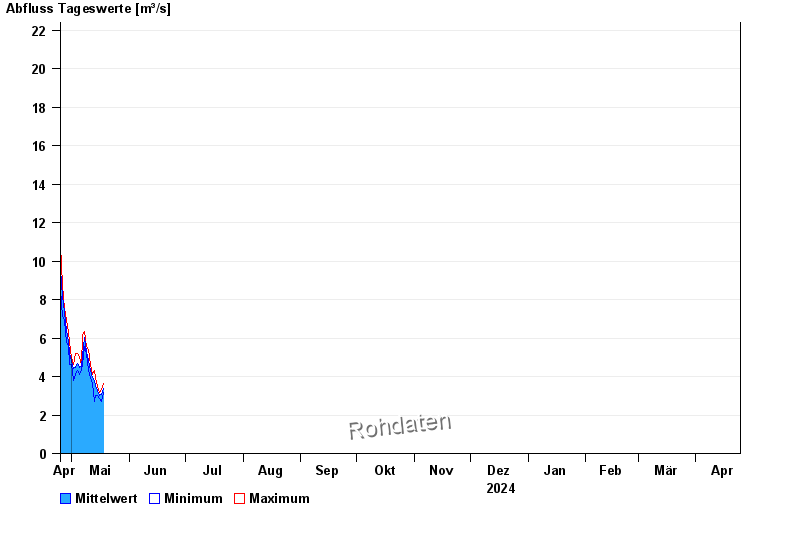
- Chart of year

Chart of year Wildenau / Haidenaab
Discharge from 25.04.2024 to 24.04.2025
- HQ1 49 m³/s
- HQ2 66,4 m³/s
- HQ5 80 m³/s
- HQ10 105 m³/s
- HQ20 125 m³/s
- HQ50 160 m³/s
- HQ100 190 m³/s
| Date | Mean value [m³/s] | Maximum [m³/s] | Minimum [m³/s] |
|---|---|---|---|
| 04.05.2024 | 4.84 | 5.2 | 4.48 |
| 03.05.2024 | 4.46 | 5.2 | 4.13 |
| 02.05.2024 | 4.4 | 4.65 | 3.79 |
| 01.05.2024 | 4.78 | 5.01 | 4.65 |
| 30.04.2024 | 5.24 | 5.76 | 4.65 |
| 29.04.2024 | 5.81 | 6.34 | 5.57 |
| 28.04.2024 | 6.37 | 6.93 | 5.76 |
© Bayerisches Landesamt für Umwelt 2024