
- Start >
- Rivers >
- Discharge >
- Naab - Regen >
- Wildenau >
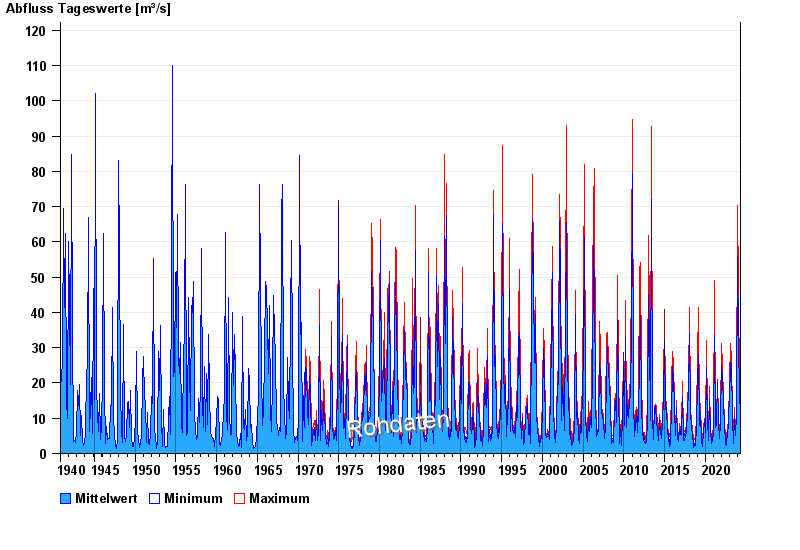
- Chart of total period

Chart of total period Wildenau / Haidenaab
Discharge from 01.11.1940 to 26.04.2024
| Date | Mean value [m³/s] | Maximum [m³/s] | Minimum [m³/s] |
|---|---|---|---|
| 26.04.2024 | 8.24 | 8.73 | 7.12 |
| 25.04.2024 | 9.58 | 10.8 | 8.53 |
| 24.04.2024 | 12.6 | 13.5 | 10.8 |
| 23.04.2024 | 13 | 13.5 | 11.7 |
| 22.04.2024 | 10.8 | 11.7 | 10.4 |
| 21.04.2024 | 9.11 | 10.6 | 7.32 |
| 20.04.2024 | 6.27 | 7.52 | 5.38 |
© Bayerisches Landesamt für Umwelt 2024