
- Start >
- Rivers >
- Discharge >
- Naab - Regen >
- Warnbach >
- Chart of year

Chart of year Warnbach / Schwarzach
Discharge from 30.07.2020 to 29.07.2021
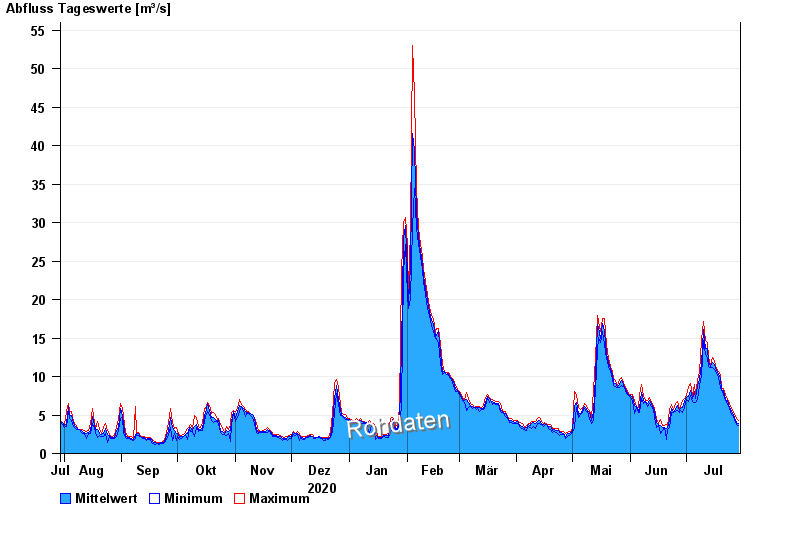
| Date | Mean value [m³/s] | Maximum [m³/s] | Minimum [m³/s] |
|---|---|---|---|
| 29.07.2021 | 3.93 | 4.27 | 3.61 |
| 28.07.2021 | 4.05 | 4.59 | 3.72 |
| 27.07.2021 | 4.71 | 5.03 | 4.37 |
| 26.07.2021 | 5.01 | 5.47 | 4.81 |
| 25.07.2021 | 5.47 | 5.8 | 5.13 |
| 24.07.2021 | 6 | 6.5 | 5.83 |
| 23.07.2021 | 6.83 | 7.06 | 6.39 |
© Bayerisches Landesamt für Umwelt 2024