
- Start >
- Rivers >
- Discharge >
- Naab - Regen >
- Warnbach >
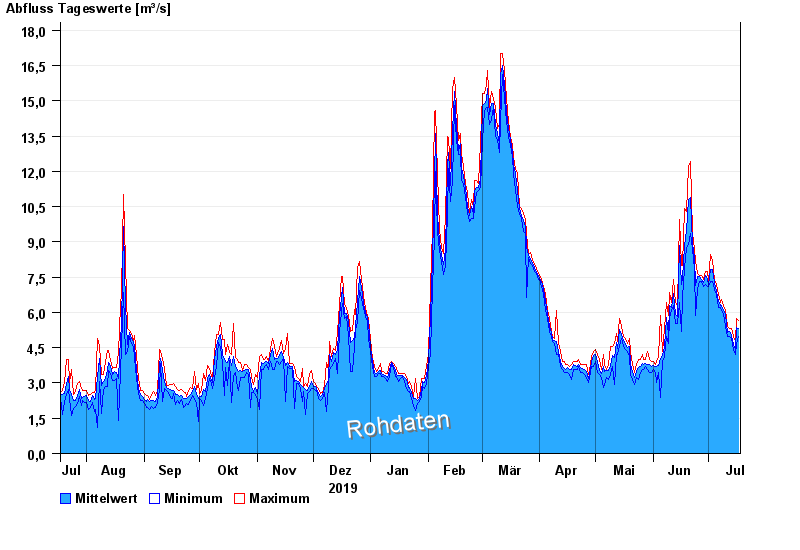
- Chart of year

Chart of year Warnbach / Schwarzach
Discharge from 18.07.2019 to 17.07.2020
| Date | Mean value [m³/s] | Maximum [m³/s] | Minimum [m³/s] |
|---|---|---|---|
| 17.07.2020 | 5.32 | 5.64 | 4.99 |
| 16.07.2020 | 5.35 | 5.75 | 4.66 |
| 15.07.2020 | 4.43 | 4.77 | 4.22 |
| 14.07.2020 | 4.64 | 4.99 | 4.44 |
| 13.07.2020 | 5.02 | 5.31 | 4.88 |
| 12.07.2020 | 5.17 | 5.31 | 4.99 |
| 11.07.2020 | 5.16 | 5.42 | 4.99 |
© Bayerisches Landesamt für Umwelt 2024