
- Start >
- Rivers >
- Discharge >
- Naab - Regen >
- Warnbach >
- Chart of year

Chart of year Warnbach / Schwarzach
Discharge from 30.03.2024 to 29.03.2025
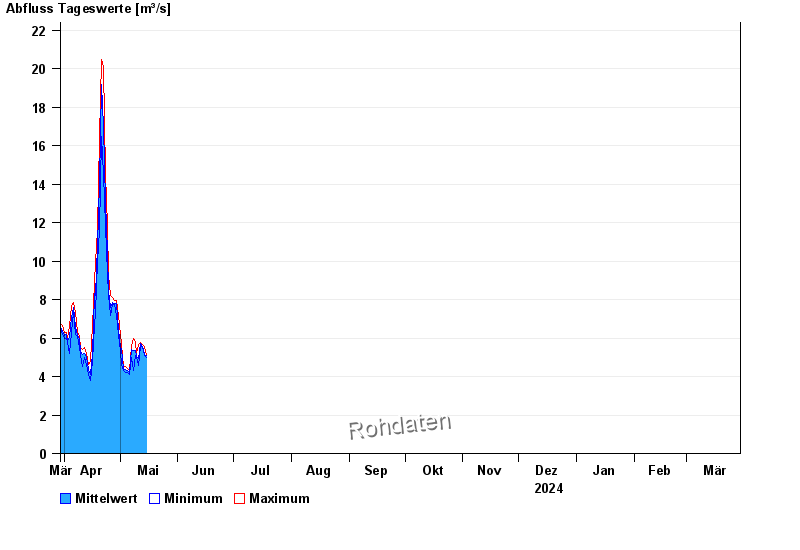
| Date | Mean value [m³/s] | Maximum [m³/s] | Minimum [m³/s] |
|---|---|---|---|
| 14.05.2024 | 5.17 | 5.55 | 5.1 |
| 13.05.2024 | 5.58 | 5.66 | 5.55 |
| 12.05.2024 | 4.93 | 4.98 | 4.76 |
| 11.05.2024 | 4.14 | 4.87 | 3.78 |
| 10.05.2024 | 4.28 | 4.44 | 4.21 |
| 09.05.2024 | 4.54 | 4.98 | 4.32 |
| 08.05.2024 | 4.56 | 5.2 | 3.56 |
© Bayerisches Landesamt für Umwelt 2024